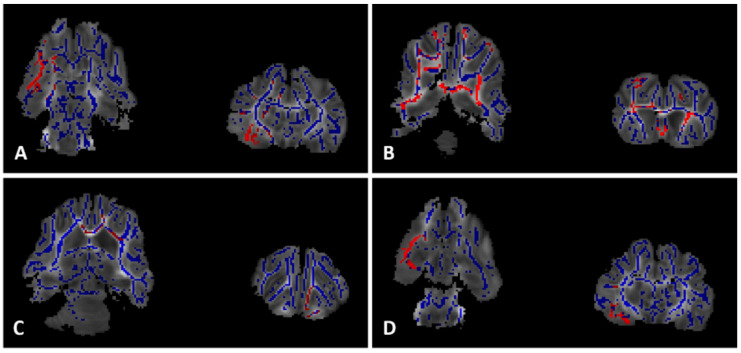
Figure 4.
Diffusion Tensor Imaging. Comparison of FA values throughout the white matter (blue). Light red indicates p < 0.15 and dark red indicates p < 0.05 after threshold-free cluster enhancement (TFCE) adjustment for multiple comparisons. (A) Contol FA values greater than Veh FA values in the dorsal striatum and substantia innominata. (B) TH FA values greater than Veh FA values throughout cerebral white matter. (C) Epo FA values greater than Veh FA values in the anterior cerebral white matter and interior capsule. (D) Control FA values greater than Epo FA values in the peri-hippocampal cerebral white matter tracts.

