Figure 5.
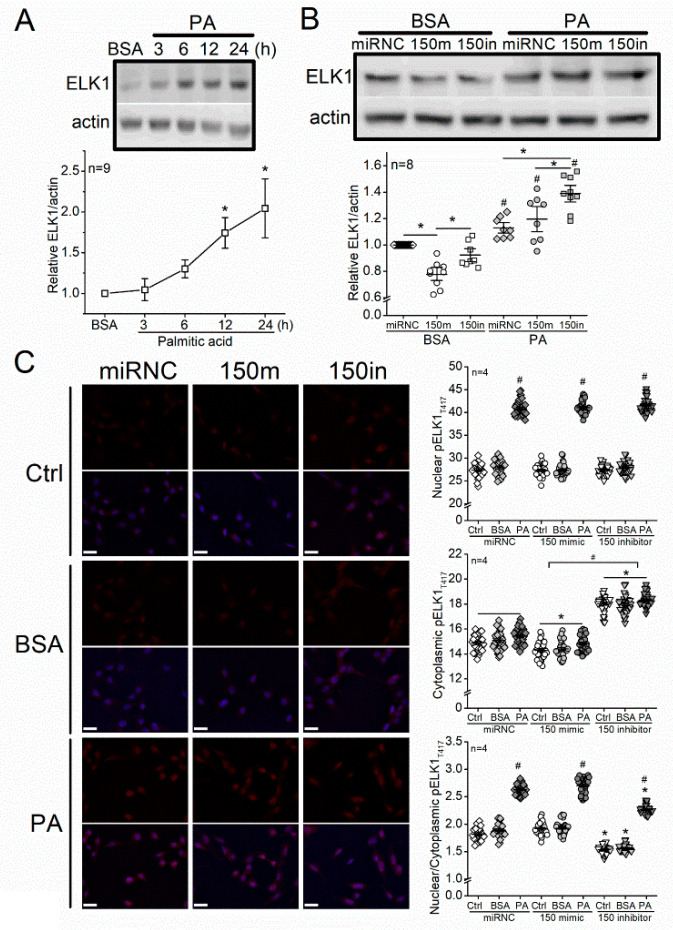
Treatment with PA increases ELK1 and nuclear pELK1T417, and knocking down miR-150 upregulates ELK1 and cytoplasmic pELK1T417 in 661W cells. (A) The 661W cells were treated with 100 µM PA or BSA (vehicle) for 3–24 h and then harvested to determine the protein levels of ELK1 via Western blots. * indicates a statistical significance from the BSA. p < 0.05, one-way ANOVA. (B) The 661W cells were first transfected with microRNA negative control (miRNC), miR-150 mimic (150 m), or miR-150 inhibitor (150 in) and then treated with BSA (vehicle) or 100 µM PA for 24 h. The ELK1 levels were determined by Western blots. miRNC-BSA: open diamond; 150 m-BSA: open circle; 150 in-BSA: open square; miRNC-PA: gray diamond; 150 m-PA: gray circle; 150 in-PA: gray square. * indicates a statistical significance when comparing among miRNC, 150m, and 150in. # indicates a statistical difference between PA and BSA. p < 0.05, one-way ANOVA. (C) The 661W cells were first transfected with microRNA negative control (miRNC), miR-150 mimic (150 m), or miR-150 inhibitor (150 in) and then treated with culture medium (Ctrl), BSA (vehicle), or 100 µM PA (PA) for 24 h. Cells were fixed and immunostained with pELK1T417 (red) and DAPI (blue). The fluorescent intensities of pELK1T417 in the nucleus or cytoplasm were quantified with ImageJ, and the intensity ratios of nuclear/cytoplasmic pELK1T417 were calculated. miRNC-Ctrl: open diamond; miRNC-BSA: gray diamond; miRNC-PA: dark diamond; 150 mimic-Ctrl: open circle; 150 mimic-BSA: gray circle; 150 mimic-PA: dark circle; 150 inhibitor-Ctrl: open triangle; 150 inhibitor-BSA: gray triangle; inhibitor-PA: dark triangle. For nuclear pELK1T417, # indicates a statistical significance when compared with BSA. For cytoplasmic pELK1T417, * indicates a statistical significance when compared with miRNC, and # indicates a statistical significance between 150 mimic and 150 inhibitor. For nuclear/cytoplasmic pELK1T417 ratio, # indicates a statistical significance when compared with BSA, and * indicates a statistical difference when compared with miRNC. p < 0.05, one-way ANOVA. Scale bar: 30 µm.

