Figure 6.
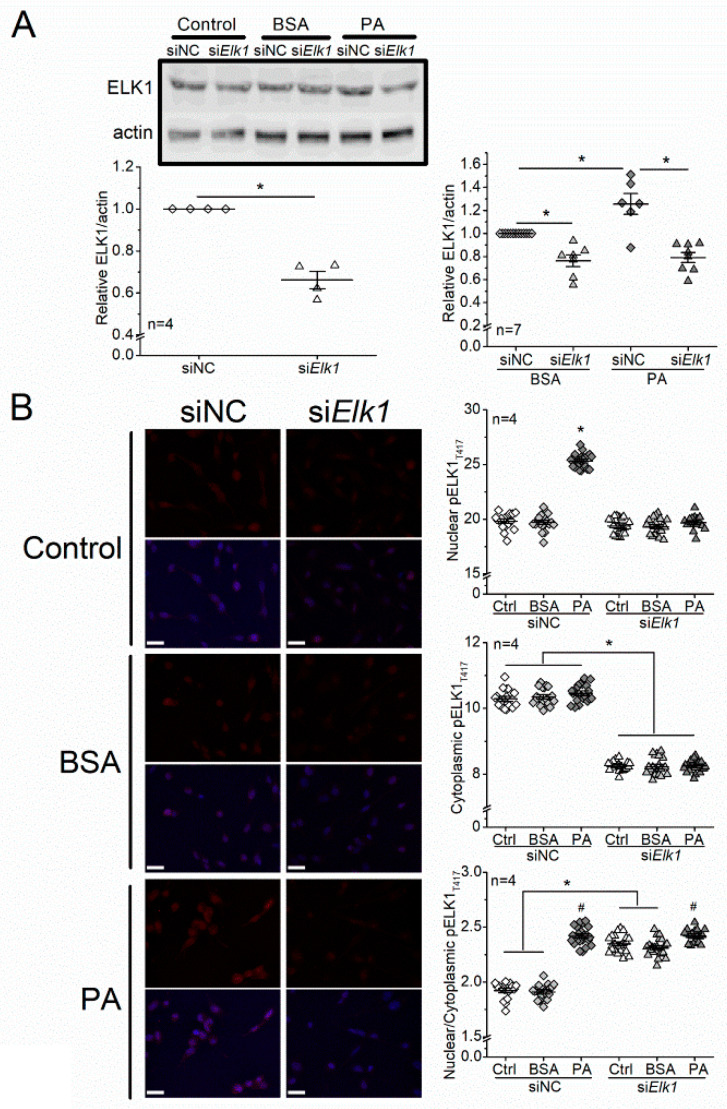
Knocking down Elk1 decreases PA-elicited increases in total ELK1 and pELK1T417 in 661W cells. (A) The 661W cells were transfected with siRNA negative control (siNC) or Elk1 siRNA (siElk1) and treated with culture medium (Ctrl), BSA, or 100 µM PA (PA) for 24 h. The ELK1 levels were determined by Western blots. siNC-Ctrl: open diamond; siElk1-Ctrl: open triangle; siNC-BSA: gray diamond; siElk1-BSA: gray triangle; siNC-PA: dark diamond; siElk1-PA: dark triangle. The left panel * indicates a statistical significance between siNC and siElk1; p < 0.05; Student’s t-test. The right panel * indicates a statistical significance between groups specified with a horizontal line; p < 0.05, one-way ANOVA. (B) The 661W cells were cultured on coverslips and transfected with siRNA negative control (siNC) or Elk1 siRNA (siElk1) and treated with culture medium (Ctrl), BSA, or 100 µM PA (PA) for 24 h. Cells were fixed and immunostained with pELK1T417 (red) and DAPI (blue). The fluorescent intensities of pELK1T417 in the nucleus or cytoplasm were quantified with ImageJ, and the intensity ratios of nuclear/cytoplasmic pELK1T417 were calculated. siNC-Ctrl: open diamond; siNC-BSA: gray diamond; siNC-PA: dark diamond; siElk1-Ctrl: open triangle; siElk1-BSA: gray triangle; siElk1-PA: dark triangle. For nuclear pELK1T417, * indicates a statistical significance when compared with siNC-BSA. For cytoplasmic pELK1T417, * indicates a statistical significance between siNC and siElk1 regardless of treatments (Ctrl, BSA or PA). For nuclear/cytoplasmic pELK1T417 ratio, # indicates a statistical significance when compared with the BSA within siNC or siElk1. * indicates a statistical significance between siElk1 and siNC specified with a horizontal line. p < 0.05, one-way ANOVA. Scale bar: 30 µm.

