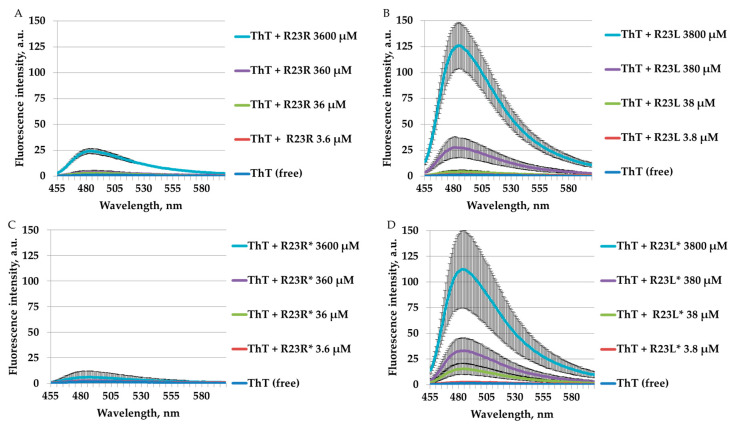
Figure 6.
Spectra of fluorescence intensity of free thioflavin T (ThT) and in solution with individual peptides R23R (A), R23L (B), R23R* (C), and R23L* (D) under conditions of 50 mM TrisHCl, 150 mM NaCl, pH 7.5, 20% (volume/volume) DMSO after 24 h at 37 °C. Error bars with standard deviations for the mean values of the measured fluorescence intensity are shown.

