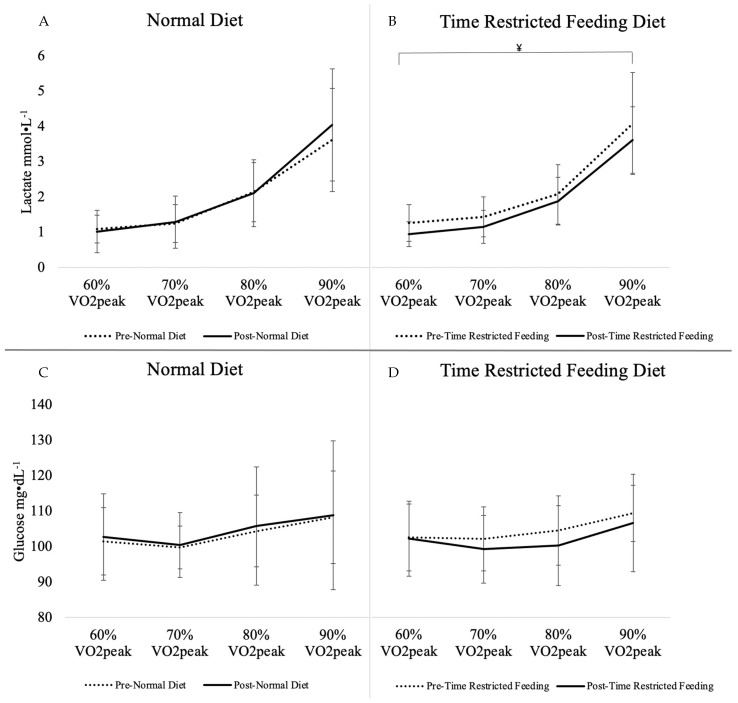
Figure 1.
Blood Lactate and Glucose from Substrate Utilization Trial by Intensity. (A) Lactate response from normal diet, (B) Lactate response from time restricted feeding, (C) Glucose response from normal diet, (D) Glucose response from time restricted feeding. ¥, Interaction of TRF diet x intensity is significantly different from ND, p < 0.05. Values are means with SD, n = 15; VO2peak, peak oxygen consumption.

