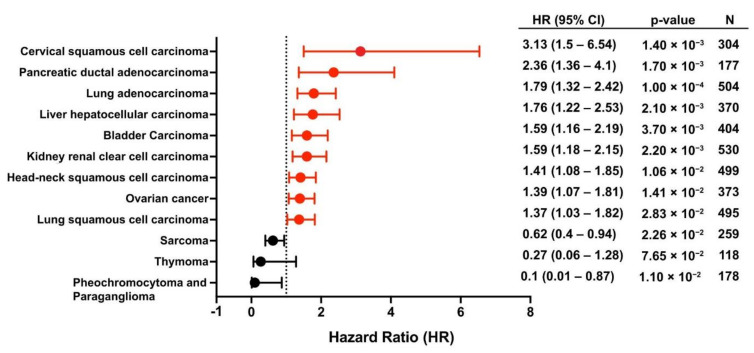
Figure 4.
The prognostic value of plectin on overall patient survival across different cancer types was evaluated using the Kaplan–Meier plotter database’s pan-cancer option, consisting of RNA-seq data from TCGA repositories (accessed on 22 July 2021) [102]. The “auto-select” option was used to stratify patients into high- and low-expressing groups. The software calculated the HR, a measure of the relative risk of patients with high plectin mRNA expression compared to patients with low expression, and the 95% confidence intervals (CIs). The log-rank p-value and sample size (N) are specified. Increased risk: HR > 1 (red); reduced risk: HR < 1 (black); no difference = 1 (dashed line).

