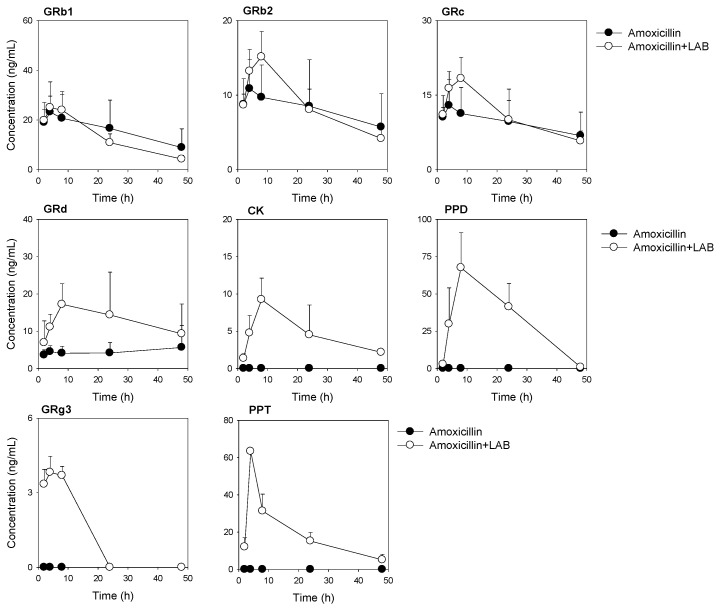
Figure 7.
Plasma concentration–time profile of ginsenoside Rb1 (GRb1), GRb2, GRc, GRd, CK, PPD, GRg3, GF2, and PPT in mice following single oral administration of RGE (2 g/kg) after repeated oral administration of amoxicillin with or without repeated LAB treatment. Data point represents the mean ± standard deviation (n = 3).

