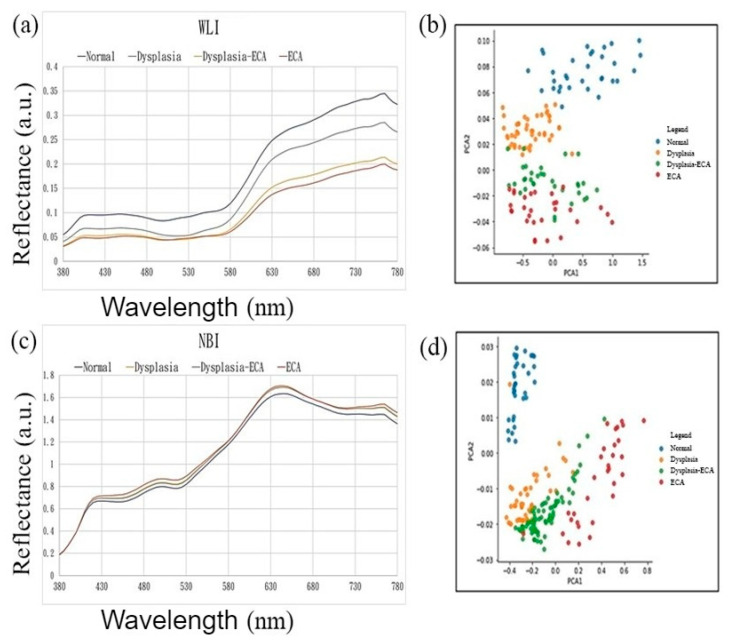
Figure 3.
White-light and narrow-band endoscopic imaging of esophageal cancer spectrum and dimensionality reduction data distribution map. (a) White-light endoscopic images of esophageal cancer spectrum; (b) white-light endoscopic images of esophageal cancer spectrum dimensionality reduction data in the first two principal components of the data distribution map; (c) narrow-band endoscopic imaging of esophageal cancer spectrum; (d) narrow-band endoscopic imaging of esophageal cancer spectrum dimensionality reduction data in the first two principal components of the data distribution map.

