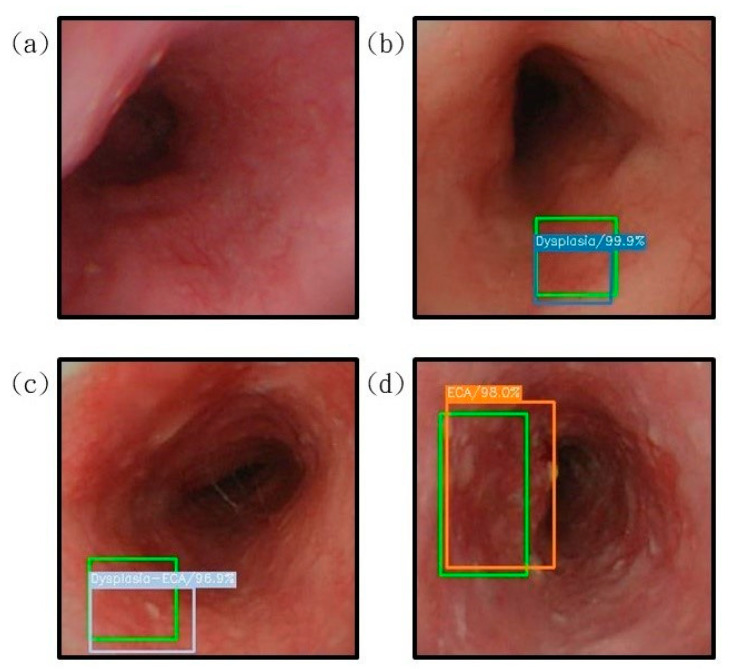
Figure 4.
The results of the prediction of esophageal cancer on the white-light endoscopic imaging. The correct position is represented by green rectangle is shown for comparison with the predicted result. (a) The result of the esophagus test is normal. It is not displayed under the diagnosis of SSD. (b) represents the detection result of the area with low-grade dysplasia, under the diagnosis of SSD, the blue bounding box surrounds the lesion area; (c) shows the area with high-grade dysplasia. The test result shows that the gray bounding box surrounds the lesion area under the diagnosis of SSD; (d) shows the detection result of the invasive cancer area, and the orange bounding box surrounds the lesion area under the diagnosis of SSD.

