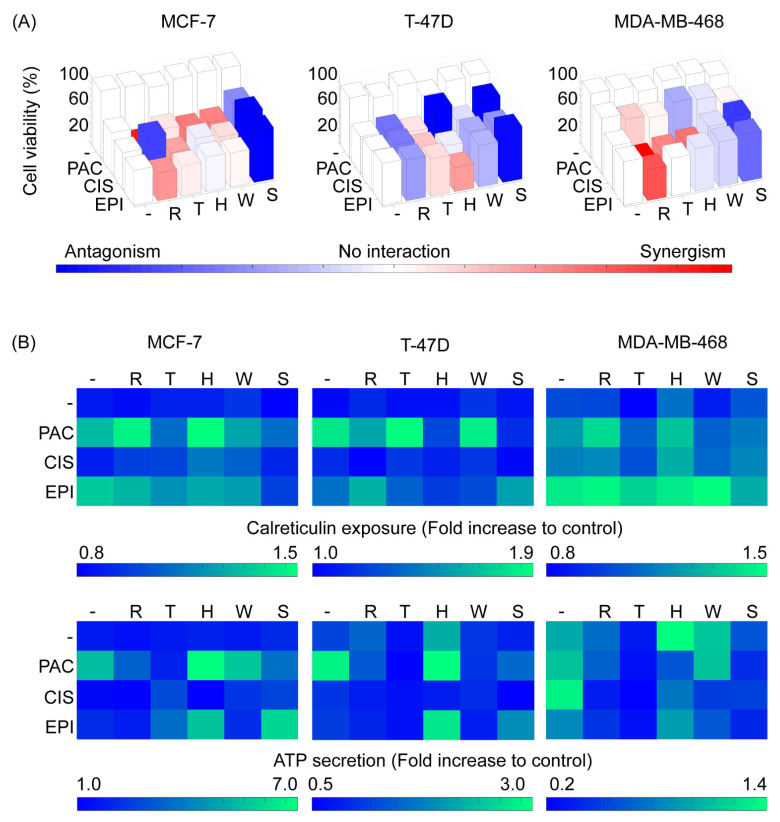
Figure 3.
Cell line-specific profiles of cytotoxicity and cell death immunogenicity arise from the interactions between autophagy regulators and chemotherapeutic perturbations. (A) Cytotoxicity profiles for each chemotherapeutic drug and autophagy regulator combination for each cell line. Single perturbations are represented as white bars, while double perturbations are colored from blue (strong antagonism) to red (strong synergism) passing through white (no interaction). (B) Calreticulin exposure upon 24 h and ATP secretion upon 72 h of single and combined treatments. CIS: cisplatin, EPI: epirubicin, H or HCQ: hydroxychloroquine, PAC: paclitaxel R: rapamycin, S: Spautin-1, T: Torin-2, W: wortmannin.

