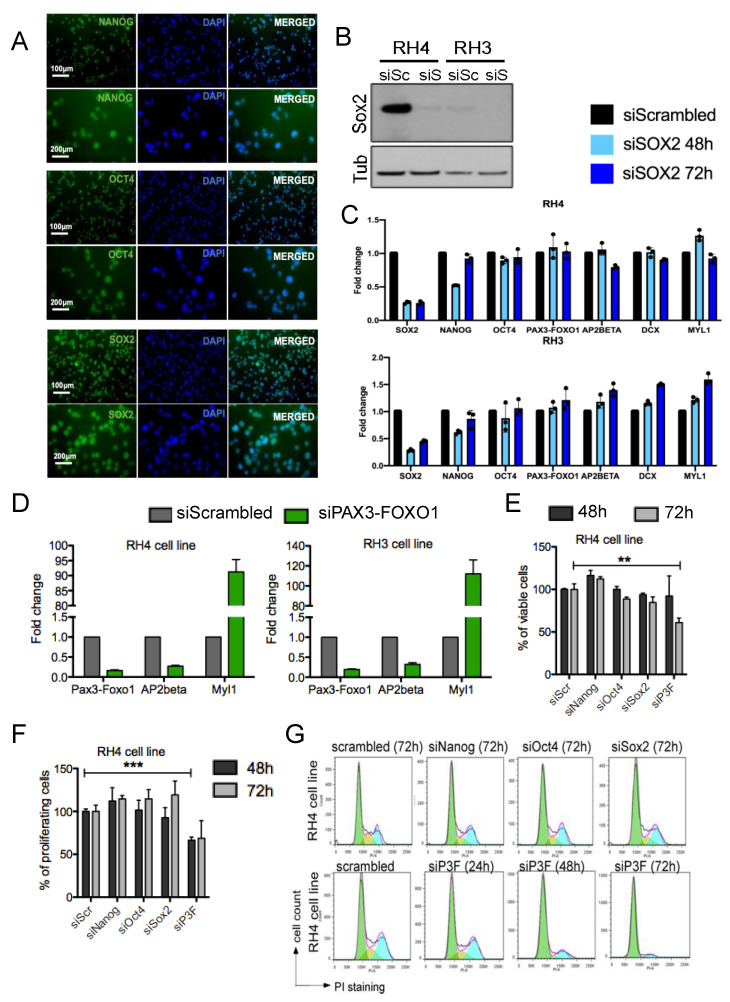
Figure 3.
FPRMS cells express the core stem cell factors but only altered expression of PAX3-FOXO1 affects their cellular physiology. (A) Immunofluorescence for NANOG, OCT4, and SOX2 in RH3 cell line. (B) Western blot analysis of SOX2 expression after 72 h of siRNA-mediated silencing in RH4 and RH3 FPRMS cells. siSc = siScrambled; siS = siSOX2. (C) RNA expression analysis for the indicated genes after 48 h and 72 h of SOX2 silencing with a specific siRNA in RH4 and RH3 cells. Fold changes are calculated compared to cells treated with scrambled siRNA. Represented are means of triplicates (n = 3). (D) RNA expression analysis for the indicated genes after 72 h silencing of PAX3-FOXO1 in RH4 and RH3 cells. Fold changes are calculated compared to cells treated with scrambled siRNA. Represented are means of triplicates (n = 3). (E) Cell viability measurements (WST-1 assay) upon 48 h and 72 h of knockdown of PAX3-FOXO1 (siP3F), NANOG, OCT4, and SOX2 in RH4 cells. Percentage of viable cells was calculated compared to scrambled cells (siScr). Represented are means of triplicates (n = 3). Statistical analysis: Unpaired t-test, ** p < 0.001. (F) Cell proliferation assay (BrdU incorporation) after 48 h and 72 h of PAX3-FOXO1, NANOG, OCT4, and SOX2 knockdown in RH4 cells. Percentages are calculated relative to the scrambled control cells. Represented are means of triplicates (n = 3). Statistical analysis: Unpaired t-test, *** p < 0.0001. (G) Flow cytometric analysis of RH4 cell cycle distribution using propidium iodide (PI) upon silencing of PAX3-FOXO1 (siP3F), NANOG, OCT4, and SOX2 for the indicated time.

