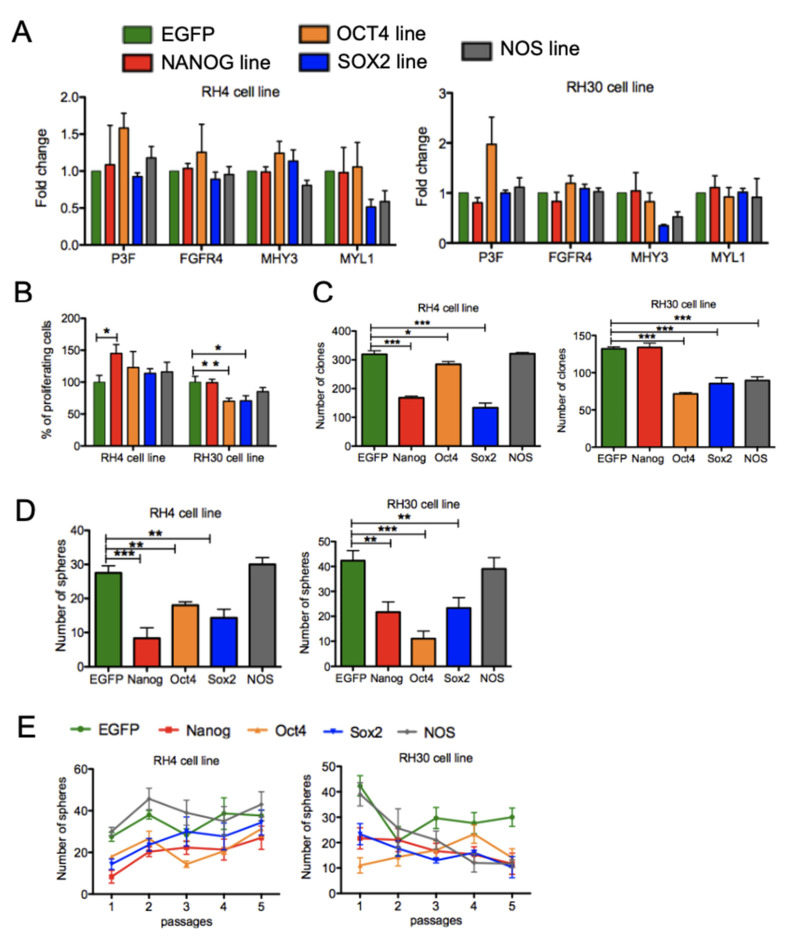
Figure 4.
Overexpression of the core stem cell factors does not enhance stem cell properties. (A) RNA expression analysis Figure 4. and RH30 transgenic cell lines overexpressing the core stem cell genes NANOG, OCT4, and SOX2 singularly or simultaneously (NOS line). For each FPRMS line an EGFP transgenic cell line was generated and used as control line. Fold changes are calculated compared to the EGFP lines. (B) Cell proliferation assay (BrdU incorporation) in RH4 and RH30 transgenic cell lines. Percentages are calculated relative to EGFP control line. Represented are means of triplicates (n = 3). Statistical analysis: Unpaired t-test, ** p < 0.005, * p < 0.05. (C) Clonogenic assay with RH4 and RH30 transgenic cell lines. Clones were stained with crystal violet and quantified. Represented are means of triplicates (n = 3). Statistical analysis: Unpaired t-test, *** p < 0.0005, * p < 0.05. (D) Primary sphere formation with RH4 and RH30 transgenic cell lines. Represented are means of triplicates (n = 3). Statistical analysis: Unpaired t-test, *** p < 0.0005, ** p < 0.005. (E) Sphere assay with RH4 and RH30 lines overexpressing the stem cell genes.

