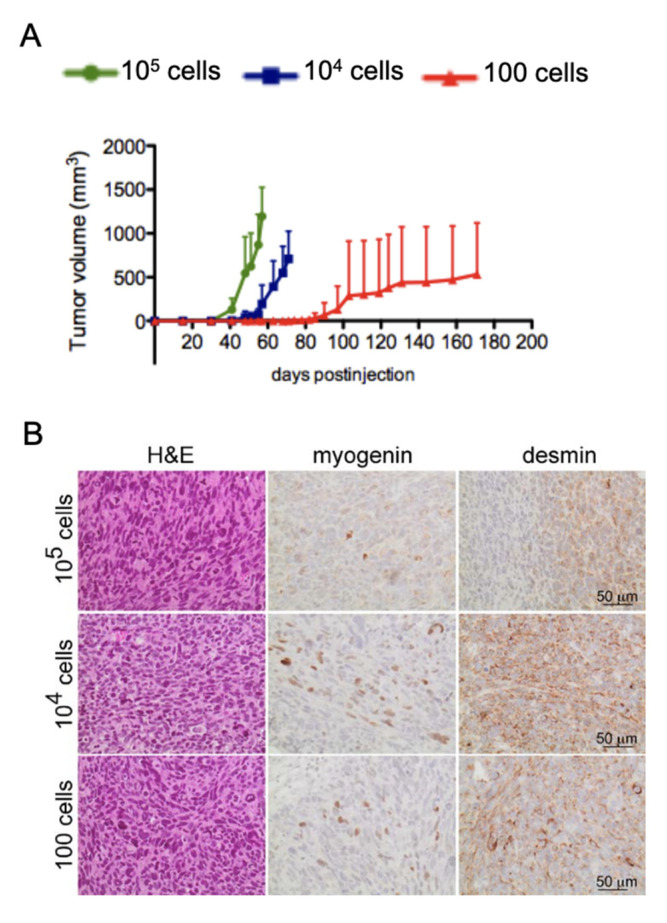
Figure 5.
High frequency of tumor initiating cells in FPRMS cells. (A) In vivo limiting dilution with RH30 cells; 105 (n = 3), 104 (n = 4), and 100 cells (n = 5) were injected intramuscularly (i.m.) into the left leg of NOD/Scid mice. Tumor growth was monitored over a period of 180 days. (B) Immunohistochemical analysis of xenografts generated from RH30 cells after injection of 105, 104, and 100 cells. Tumors were stained with H&E and the FPRMS markers MYOGENIN and DESMIN.

