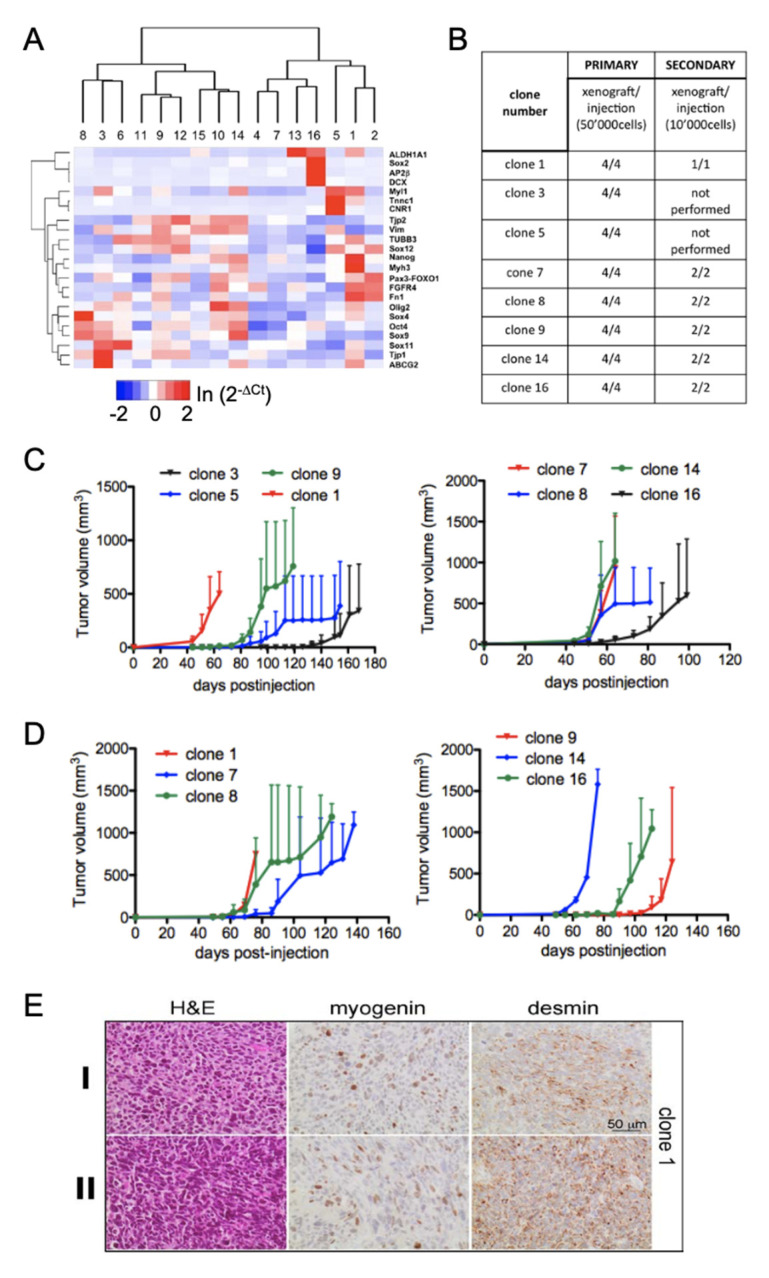
Figure 6.
Clonal analysis of cells. (A) Heat map of qRT-PCR of total RNA relative to GAPDH from RH30 single-cell derived clones. Sixteen clones were analyzed for the expression of the genes indicated. Scale bar ln(2−ΔCt). (B) Generation of primary and secondary xenografts with 8 selected RH30 clones. For primary xenograft generation 5 × 10⁴ cells were injected i.m into the left leg of NOD/Scid mice (n = 4). Single cell suspensions (104 cells) of primary tumors were injected i.m into mice (n = 2) for secondary tumor formation. (C) Tumor growth of primary xenograft clones generated from one RH30 cell. (D) Tumor growth of secondary xenografts. (E) Immunohistochemical staining of primary (I) and secondary (II) xenograft sections of clone 1. Tumors were stained with hematoxylin and eosin (H&E) and the FPRMS markers MYOGENIN and DESMIN.

