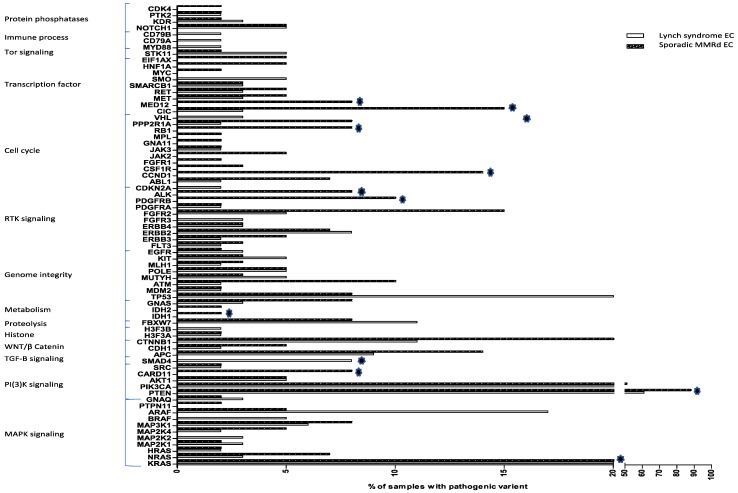
Figure 2.
Mutational profiles of LS-EC and sporadic MMRd EC. The 75 genes included in the analysis are listed on the Y-axis grouped by associated cellular process. On the X-axis, the % of tumours with a pathogenic variant in analysed genes is demonstrated. Stars indicate genes in which the proportion of pathogenic variants between sporadic MMRd and LS-EC was significantly different.

