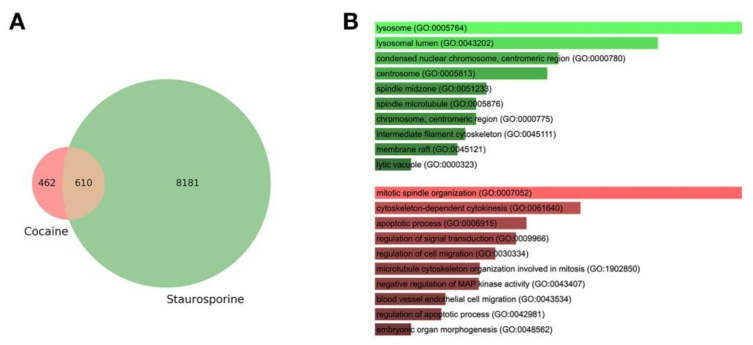
Figure 3.
(A) Differentially expressed genes upon cocaine administration. The Venn diagram shows the number of genes that are regulated at increasing dose of cocaine or staurosporine. Genes were selected at q < 1 × 10⁻³; out of 1072 genes, only 462 were found specific for cocaine. (B) Gene Ontology analysis. The bar chart shows the top 10 GO:BP (gene ontology:biological process) categories enriched for the genes specifically induced by cocaine. A large fraction of terms is related to apoptosis.

