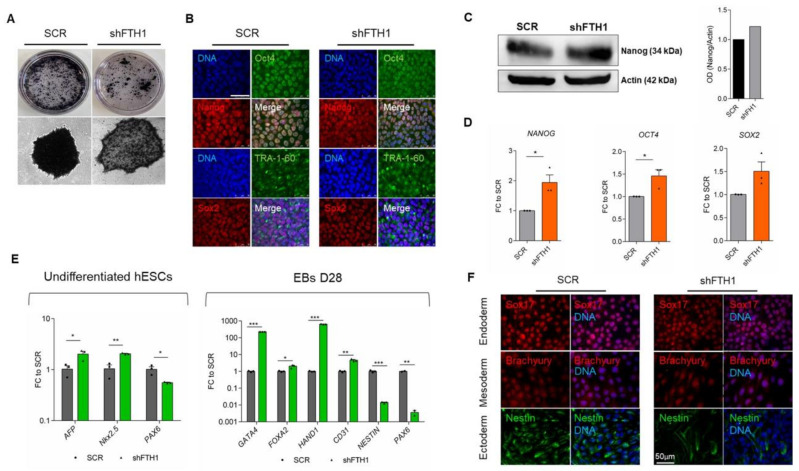
Figure 1.
FTH1 silencing influences hESCs pluripotency. (A) Alkaline phosphatase (AP) staining of colonies in SCR control and in hESCs transfected with lentiviral shFTH1 shows that FTH1-silenced ES colonies contain less AP+ cells; scale bar, 250 µm; (B) Undifferentiated SCR and FTH1-KD hESCs were stained for Oct4 (green), Nanog (red), TRA-1-60 (green), and Sox2 (red) expression, while nuclei were counterstained with 4′.6-diamidino-2-phenylindole (DAPI). Scale bars, 50 μm. No significant differences were detected between the two groups with the exception of Nanog, which shows a slight positivity in FTH1-silenced cells; (C) The levels of Nanog protein were assessed by immunoblotting (IB). Band intensity analysis shows a higher level in FTH1-KD cells compared to SCR control. Actin levels were evaluated to confirm equal loading control; (D) mRNA levels of pluripotency-associated genes NANOG, OCT4, and SOX2 were measured in undifferentiated SCR and FTH1-KD hESCs via qRT-PCR; (E) left panel: mRNA levels of endodermal (AFP), mesodermal (Nkx2.5), and ectodermal (PAX6) genes were measured in undifferentiated SCR and FTH1-silenced hESCs via qRT-PCR analysis; AFP and Nkx2.5 expression levels were higher in shFTH1 cells, while the expression levels of PAX6 were significantly diminished in silenced cells; (E) right panel: mRNA levels of endodermal (GATA4, FOXA2), mesodermal (HAND1, CD31), and ectodermal (NESTIN, PAX6) genes were measured in SCR and FTH1-KD embryoid bodies (EBs) on day 28 of differentiation by qRT-PCR; (F) Sox17, Brachyury, and Nestin, endodermal, mesodermal, and ectodermal markers, respectively, were stained via immunofluorescence in SCR and shFTH EBs on day 28 of differentiation; scale bar, 50 μm. Results of all qRT-PCR shown were normalized to value in SCR cells and are represented as mean ± SEM (n = 3); significance is calculated by t-test: * p ≤ 0.05; ** p ≤ 0.01, *** p ≤ 0.001.

