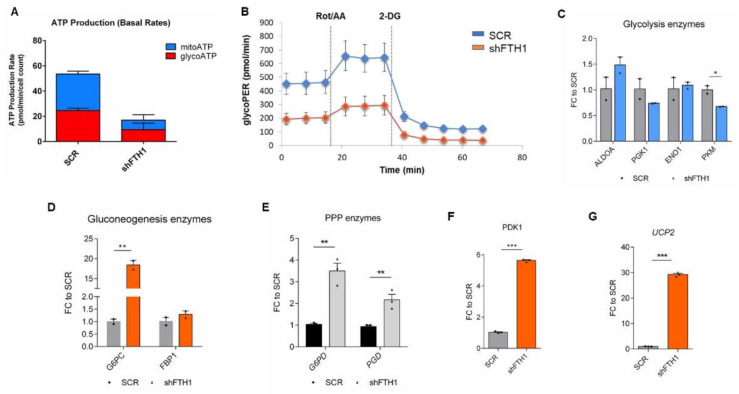
Figure 5.
Metabolic rearrangement in FTH1-KD hESCs. (A) Quantification of total cellular ATP production (from glycolysis and mitochondrial oxidative phosphorylation) rate using a Seahorse XF analyzer. ATP production was calculated by measuring the oxygen consumption and acidification rate. Each sample (SCR and shFTH1-hESCs) was measured in at least three biological replicates. Seahorse analysis shows a lower ATP production (from both sources) in FTH1-KD cells compared to SCR control; (B) Glycolytic rate measurements in SCR and FTH1-silenced cells calculated by subtracting extracellular acidification rate (ECAR). As shown, FTH1-KD hESCs do not undergo metabolic switch. Since mitochondrial acidification is blocked, the approach measures glycolytic-ECAR only correlating to extracellular lactate accumulation. Glycolytic rate was reduced in FTH1-silenced hESCs; (C) qRT-PCR analysis for glycolytic enzymes (ALDOA2, PGK1, ENO1, and PKM) mRNA expression; (D) Expression of G6PC and FBP1 gluconeogenesis genes in SCR and shFTH1-hESCs measured by qRT-PCR analysis; (E) Pentose phosphate pathway (PPP) genes G6PD and PGD were significantly up-regulated shFTH1 cells with respect to SCR control cells; (F,G) The PDK1 gene, responsible for inactivation of pyruvate dehydrogenase (F) and the gene UCP2 (G), which uncouples OXPHOS from ATP synthesis, both resulted in significantly up-regulated in FTH1-KD cells compared to SCR cells. For all qRT-PCR graphs, results were normalized to measurements in SCR cells (n = 3); * p ≤ 0.05; ** p ≤ 0.01, *** p ≤ 0.001, t-test compared to SCR. Small dots refer to SCR replicates, while triangles refer to shFTH1 triplicates.

