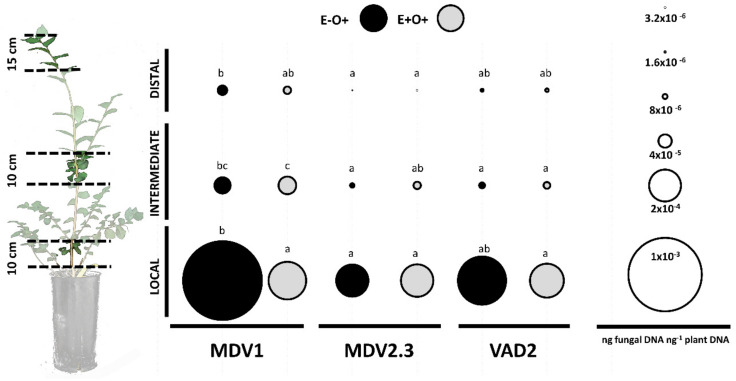
Figure 3.
Presence of O. novo-ulmi at day 21 of the experiment in local (close to the inoculation point), intermediate, and distal stem pieces. Treatments E−O+ (mock-inoculated plants subsequently inoculated with O. novo-ulmi) and E+O+ (endophyte-inoculated plants subsequently inoculated with O. novo-ulmi) were evaluated in elm genotypes MDV1, MDV2.3, and VAD2. The mean value is represented by circles whose dimensions are proportional to the fungal DNA quantity (ng fungal DNA ng−1 plant DNA) as indicated in the circle scale. Different letters indicate significant differences between treatments and genotypes according to Tukey’s HSD post-hoc test (p < 0.05). Independent analyses were performed for local, intermediate, and distal stem fragments. The results of the ANOVA analysis are detailed in Table S3.

