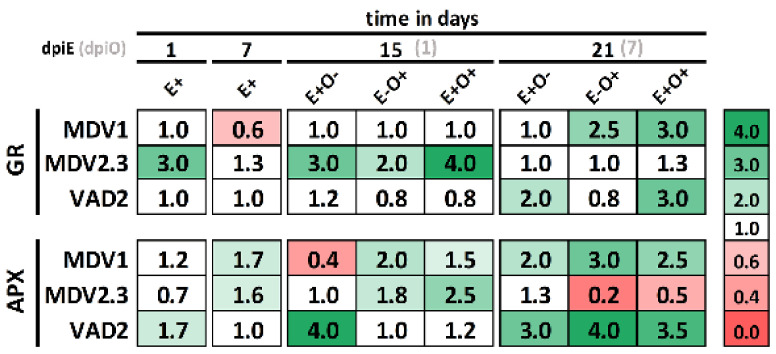
Figure 6.
Gel activities of glutathione reductase (GR) and ascorbate peroxidase (APX) at days 1, 7, 15, and 21 of the experiment in elm genotypes MDV1, MDV2.3, and VAD2. The numbers represent the fold change relative to control plants (E−O−). Colored boxes indicate modifications of ±30% of the enzyme activity with respect to control plants, with reddish or greenish colors indicating lower or higher activity than controls, respectively.

