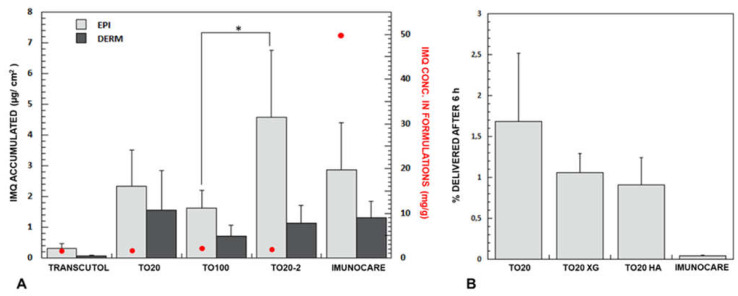
Figure 4.
(A) IMQ retention (mean ± SD, n ≥ 4) in the epidermis and dermis, red dots ( ) represent IMQ concentration in the formulations applied. Data on Transcutol® saturated solution is from [15]. (B) Delivery efficiency (% delivered after 5 h) of TO20 and semisolid formulations. (p * < 0.05); p-values obtained from t-test analysis for epidermis, dermis and total amount of the drug in the skin for all formulations tested are reported in Table S4.

