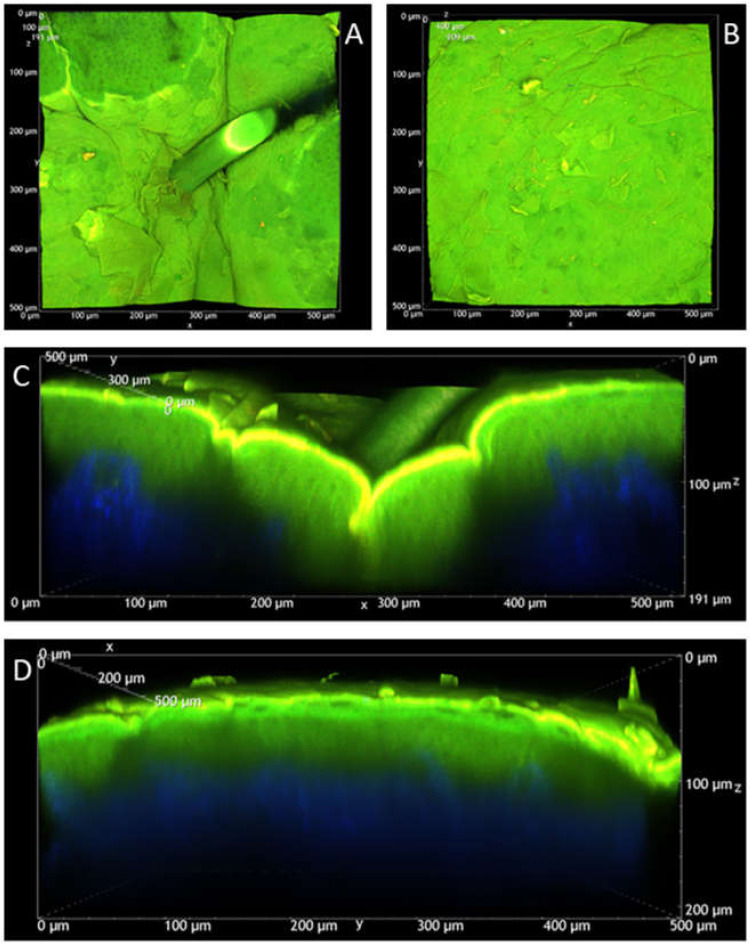
Figure A1.
Volume renderings of untreated porcine skin samples reconstructed from the Z-stacks (Z-step: 1 μm) acquired with excitation wavelength of 850 nm. XY (A) and XZ (C) views of a hair follicle (total depth: 191 μm); XY (B) and YZ (D) views of a flat skin region (total depth: 209 μm). A more complete and detailed view of the flat skin region 3D rendering is available in Supplementary Movie S2. The blue signal is due to the second harmonic generation (SHG) of the collagen present in the dermis. The green signal is due to SC and epidermis autofluorescence when irradiated at 850 nm.

