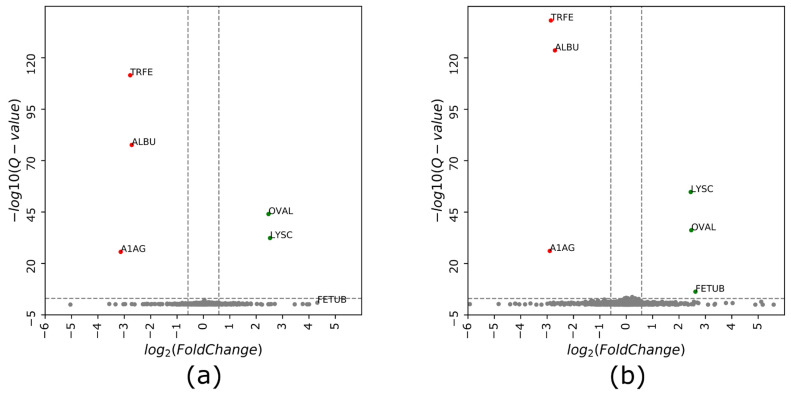
Figure 5.
Volcano plot of protein intensity ratios log2 (samples 2/1) obtained using (a) cDIA and (b) cGPF-DIA approaches. Proteins with a fold change (or ratio) ≥1.5 and a Q-value ≤ 0.001 were considered to have a significantly different expression/spike-in ratio. Shown in red are proteins that are down-regulated while green denotes up-regulated proteins. FETUB was not identified as significant differential expression in cDIA–MS due to its relatively large Q-value (0.12). Sample loading amounts and measured ratios of spike-in proteins are shown in Table 1.

