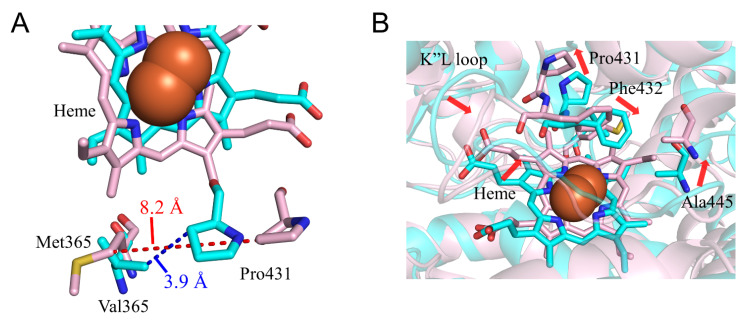
Figure 7.
Structural change in CYP2A6.17 (A,B). The wild type and CYP2A6.17 are shown in cyan and pink, respectively. Nitrogen, oxygen, and hydrogen are displayed in blue, red, and white, respectively, in the stick model. Iron is shown as an orange sphere by a model written as van der Waals radius. The red and blue dotted lines indicate the distances between Val/Met365 and Pro431. The red arrows indicate the shift in CYP2A6.17. All hydrogen atoms are omitted.

