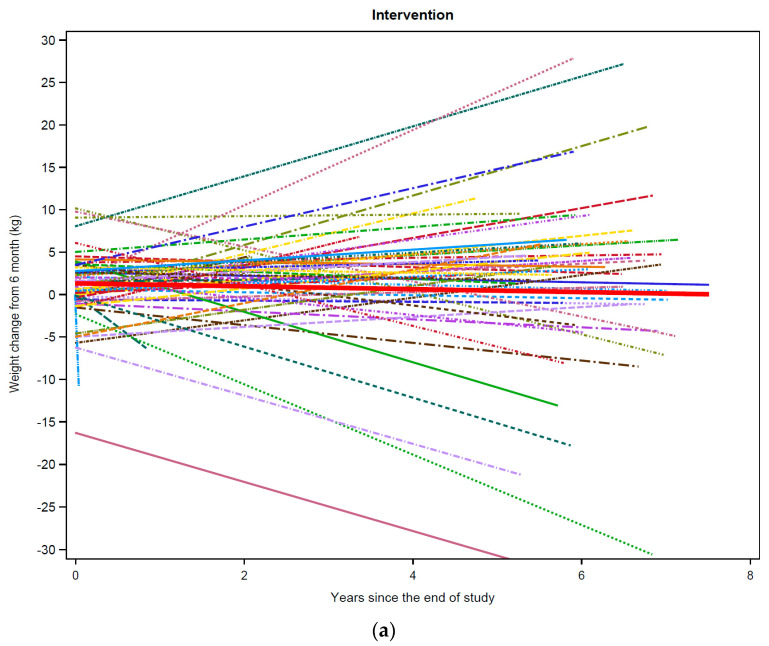
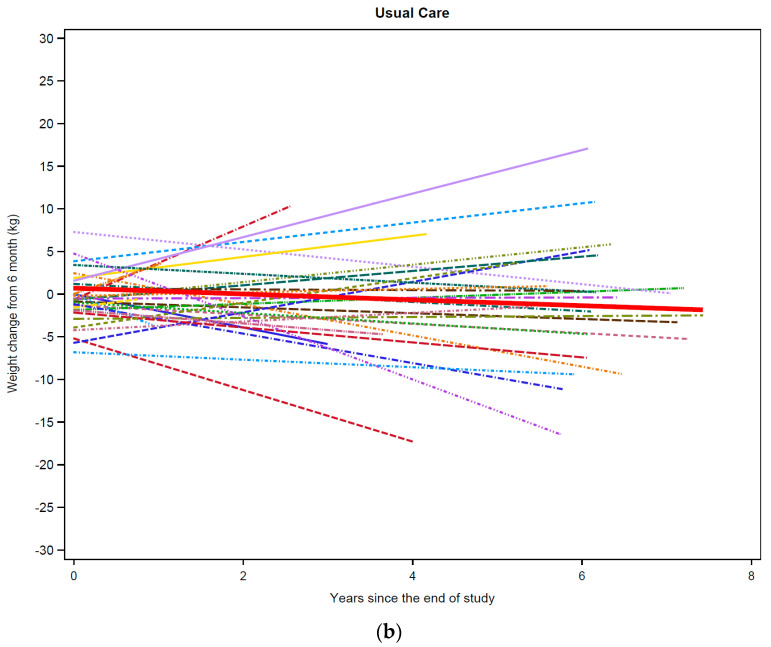
Figure 1.
Weight trajectories by study group. Weight trajectories for each individual participant from LEAN Study completion through long-term follow-up (latest date July 2019) are shown: (a) intervention group (n = 60); (b) usual care (n = 32). The thick red line in (a) corresponds to the mean weight trajectory among intervention group participants, and the thick red line in (b) corresponds to the mean weight trajectory among usual care group participants.


