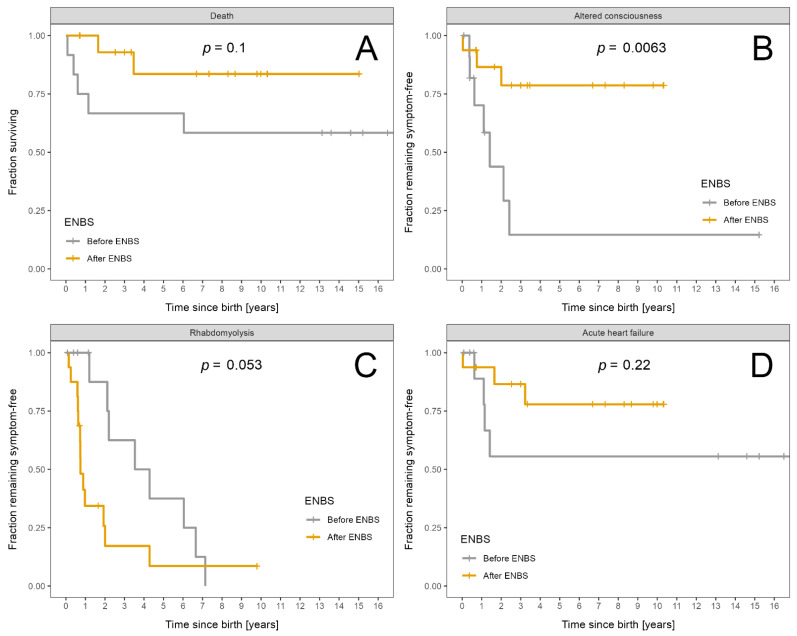
Figure 3.
Fraction of LCHADD/MTPD patients remaining alive and symptom free: Patients diagnosed before ENBS (n = 12) are shown as grey and patients diagnosed after ENBS (n = 16) as orange curves, respectively. (A) Survival probability. (B) Absence of any episode of altered consciousness. (C) Absence of rhabdomyolysis. (D) Absence of acute heart failure. Kaplan–Meier estimator was used; p designates significance of difference between the cohorts.

