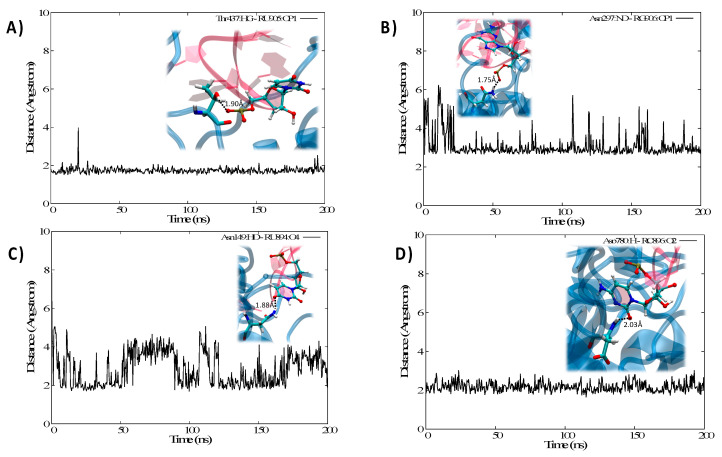
Figure 4.
Time series of the distances between selected interacting residues involving the protein and IRE involving either the loop, Thr 437 and U (A) and Asn 297 and G (B), or the edge region, Asn 49 and U (C) and Asp 780 and C (D). Representative snapshots highlighting the specific interactions at the atomic level are also given as inlays in each panel.

