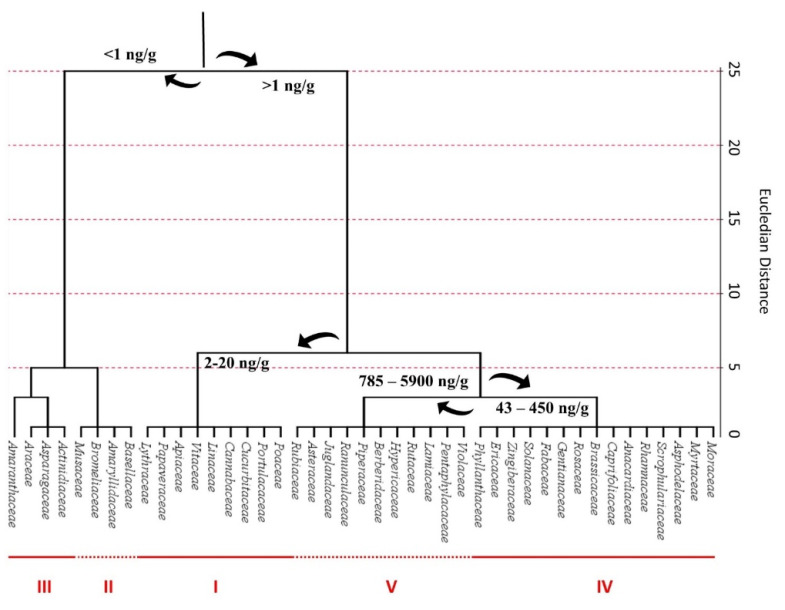
Figure 11.
Cluster distribution of melatonin within plant families, according to previously published data [38,115,129,130,131,132,133,134,135,136,137,138,139,140,141,142,143,144,145,146,147,148,149,150,151,152,153,154,155,156,157,158,159,160,161,162,163,164,165,166,167,168,169,170,171,172,173]. Euclidean distances were calculated with centroid method. Data were expressed as ng melatonin per g of FW. Statistical analysis and graphical representation were made using SPSS v. 24 software.

