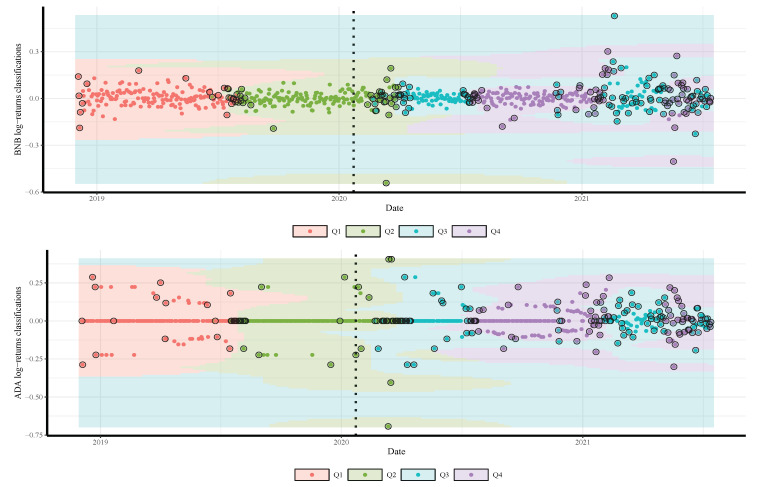
Figure 6.
Classifications of BNB (top) and ADA (bottom) daily returns based on quartiles of daily gold prices predicted by SVM model. The vertical dotted line represents the threshold between the pre-COVID-19 period (left) and ongoing COVID-19 period (right) to visualize its impact on the cryptocurrency return.

