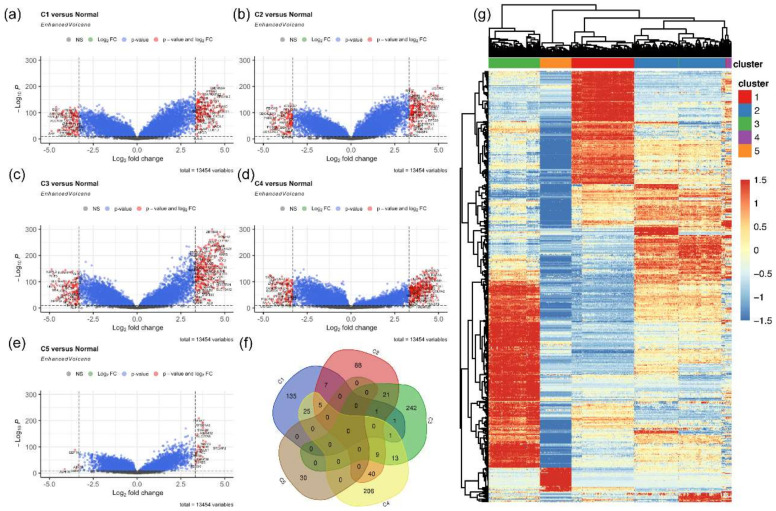
Figure 4.
Differentially expressed genes (DEGs) in each cluster compared to normal tissues. Volcano plots comparing the fold change in clusters and normal tissues illustrate DEGs in (a) cluster 1, (b) cluster 2, (c) cluster 3, (d) cluster 4 and (e) cluster 5. Statistically significant DEGs which meet the fold change cut-off are represented by red dots (adjusted p < 0.001), blue dots represent significant DEGs beyond the log2 fold change cut-off (adjusted p < 0.001), and grey dots represent non-significant genes. (f) Venn diagram of upregulated DEGs that are unique in each cluster. (g) Heatmap of the upregulated DEGs that are unique in each cluster.

