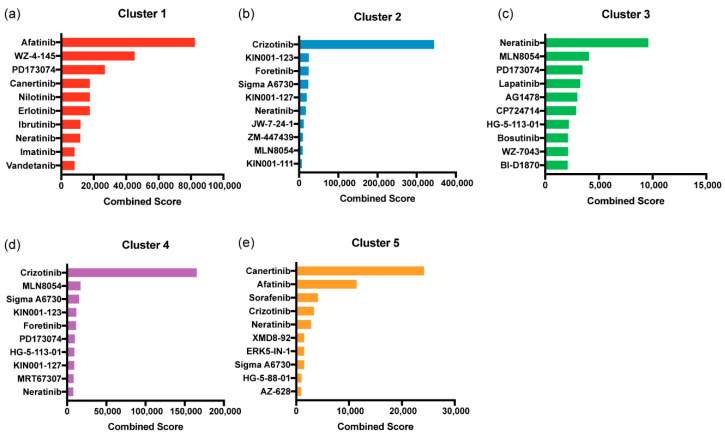
Figure 6.
Enriched kinase inhibitors to target the RTK profile in each CCA cluster. The RTK profile of each CCA cluster was queried as gene list in Enrichr using the Harvard Medical School (HMS) KinomeScan Database. The resultant drugs that target the RTKs were filtered for significance (p < 0.05) and ranked according to the Enrichr combined score (also known as enrichment score) Reprinted from ref. [28]. The top 10 drugs enriched in (a) cluster 1, (b) cluster 2, (c) cluster 3, (d) cluster 4, and (e) cluster 5 are represented in the bar plot. Reprinted from ref. [18].

