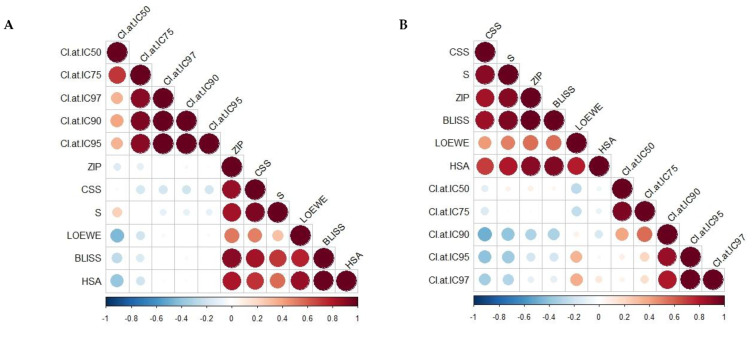
Figure 3.
Correlation matrix of different synergy metrics and combination sensitivity scores (CSSs) using (A) Pearson and (B) Spearman correlation coefficients. CI = combination index derived from Chou–Talalay model; IC = inhibitory concentration killing the corresponding percentage of MCF7 cells. Colour indicates the correlation coefficient along with negative correlations in blue and positive correlations in red, with the size being directly proportional to statistical confidence based on p-values.

