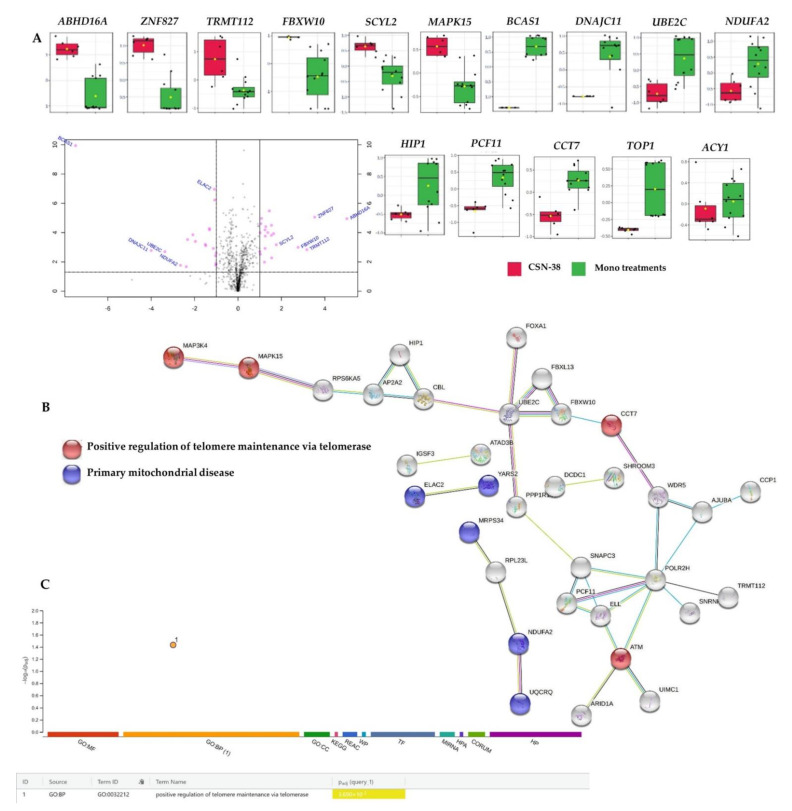
Figure 8.
Differentially expressed proteins in synergistic CBD and SN−38 combination-treated MCF7 cells (CSN−38) compared to the monotherapies, and the corresponding overrepresented pathways. (A) Volcano plot with an absolute log2 fold change ≥ 1 and p-value ≤ 0.05 cutoff of the identified proteins in the CSN−38-treated cells, together with the selected proteins’ expression summary compared to the monotherapies. (B) STRING network of the 91 differentially expressed proteins (fold change ≥ 2; p and Q values ≤ 0.05). The minimum required interaction score was 0.40 (medium confidence), and red, green, blue, purple, light blue, and black interaction lines indicate the presence of fusion, neighbourhood, co-occurrence, experimental, database, and co-expression evidence, respectively. The disconnected nodes were hidden in the network. (C) Overrepresented pathways using g:Profiler for the differentially expressed proteins (fold change ≥ 2; p and Q values ≤ 0.05).

