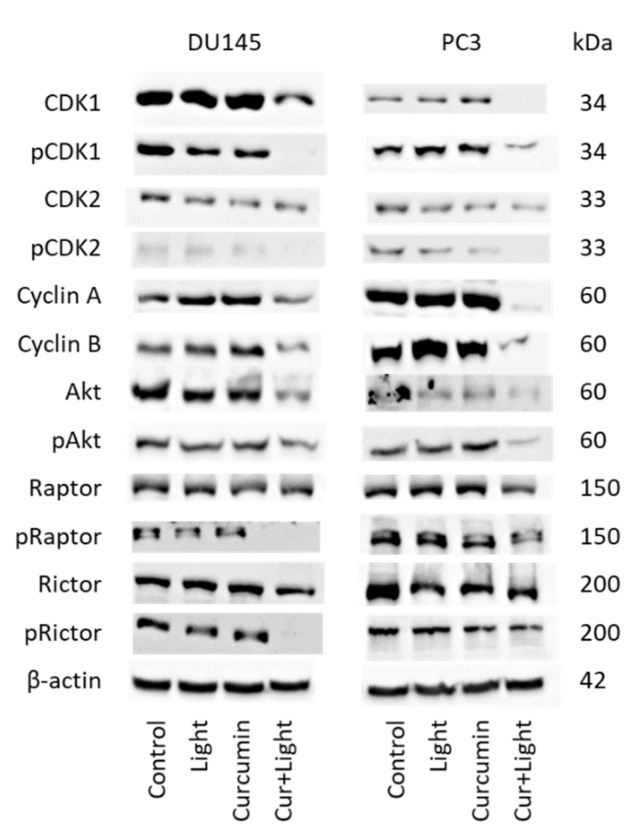
Figure 5.
Protein expression profile of cell cycle regulating proteins in the presence of visible light (5 min at 1.65 J/cm2), curcumin (0.2 µg/mL) and the combination of curcumin plus light (Cur + Light) on DU145 and PC3 cells. Controls remained untreated. The protein isolation was carried out 24 h after treatment. ß-actin was used as the internal control. Each experiment was repeated 3 times. Data from one representative experiment is shown.

