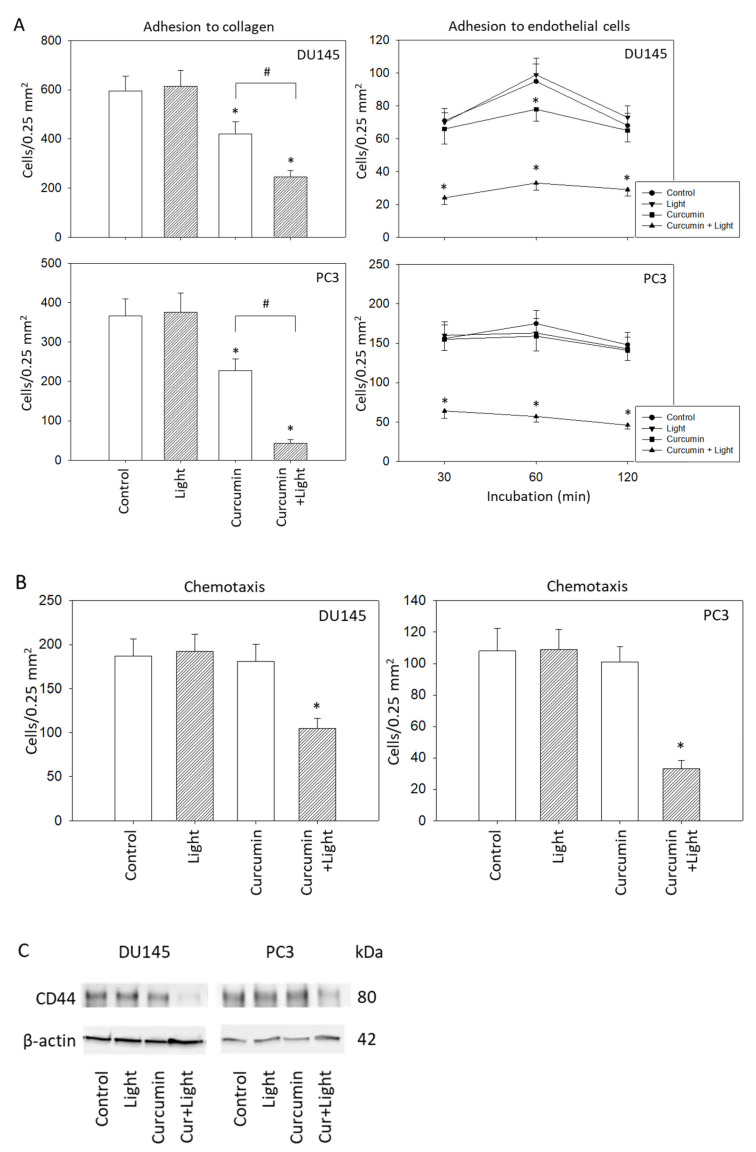
Figure 6.
(A): Adhesion characteristics of DU145 and PC3 cells following exposure to visible light (5 min at 1.65 J/cm2), curcumin (0.2 µg/mL) or light alone, or to the curcumin–light combination. Controls depict untreated cells. The left panel of (A) shows cell binding to immobilized collagen, the right panel of (A) shows cell adhesion to endothelial cells. (B): Motility of treated versus non-treated DU145 and PC3 cells. Mean values were calculated from five counts; error bars indicate standard deviation; * indicates significant difference to the control; # indicates significant difference between the curcumin treated and the curcumin–light treated cells. (C): CD44 expression in DU145 and PC3 cells in the presence of visible light, curcumin, or curcumin+light (Cur + Light). Controls remained untreated. One representative result is shown.

