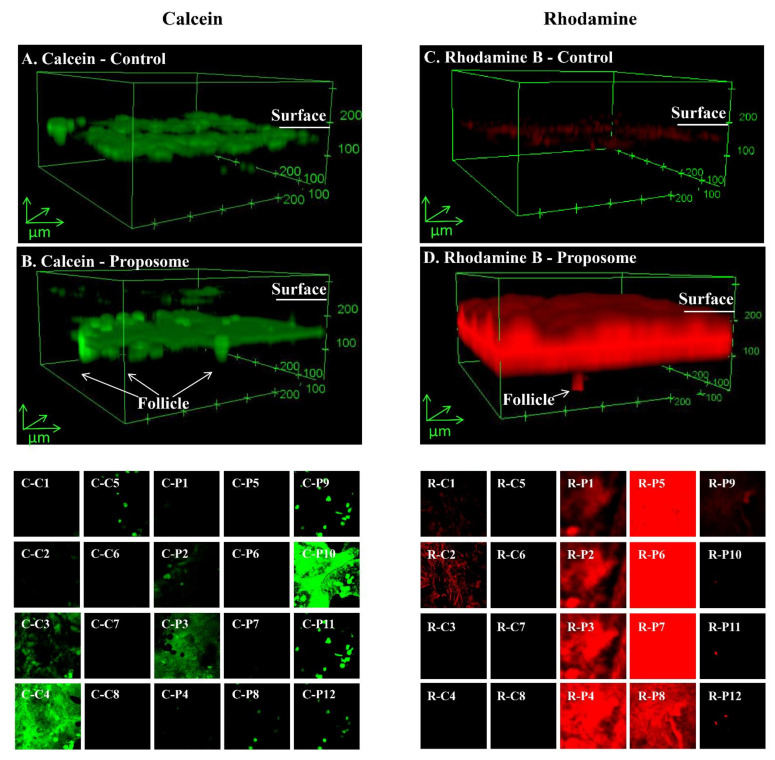
Figure 6.
The confocal microscopic images showing fluorescent calcein control (A) /proposome (B) and rhodamine B (C) /proposome (D) penetration into human skin after 24 h treatment. Sliced images of calcein control (C-C1 to C8)/proposomes (C-P1 to P12, and of rhodamine B control (R-C1 to C8) and proposome (R-P1 to P12). Each slice is 20µm. The control was 0.2% w/v calcein or rhodamine B solution in 30% PG. The concentrations of calcein and rhodamine B were same for proposomes and control.

