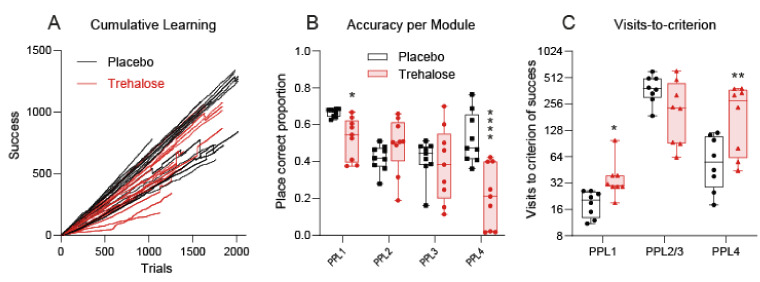
Figure 6.
Learning in IntelliCage Place Preference Learning (PPL) tasks. (A): The XY plots shows the cumulative number of trials versus the cumulative number of successes, analyzed for each PPL period. Hence, each mouse is represented by four lines. The steepness of the learning curves is lower for trehalose-treated mice, particularly in PPL-1 and PPL-4. (B): Accuracy (proportion of correct visits) per learning module. (C): Number of trials needed to reach the criterion of success which was defined as 10% above random, i.e., 60% in PPL-1 and 35% in PPL-2, 3, and 4. PPL2/3 were analyzed together. The box shows the interquartile range, the line the median, the whiskers minimum to maximum, the scatters individual mice. Data in B and C were compared with 2-way ANOVA for “module” x “treatment” and subsequent post hoc analysis for trehalose versus vehicle, using an adjustment of alpha according to Šidák. Asterisks show multiplicity-adjusted p-values, * < 0.05; ** < 0.01, **** < 0.0001.

