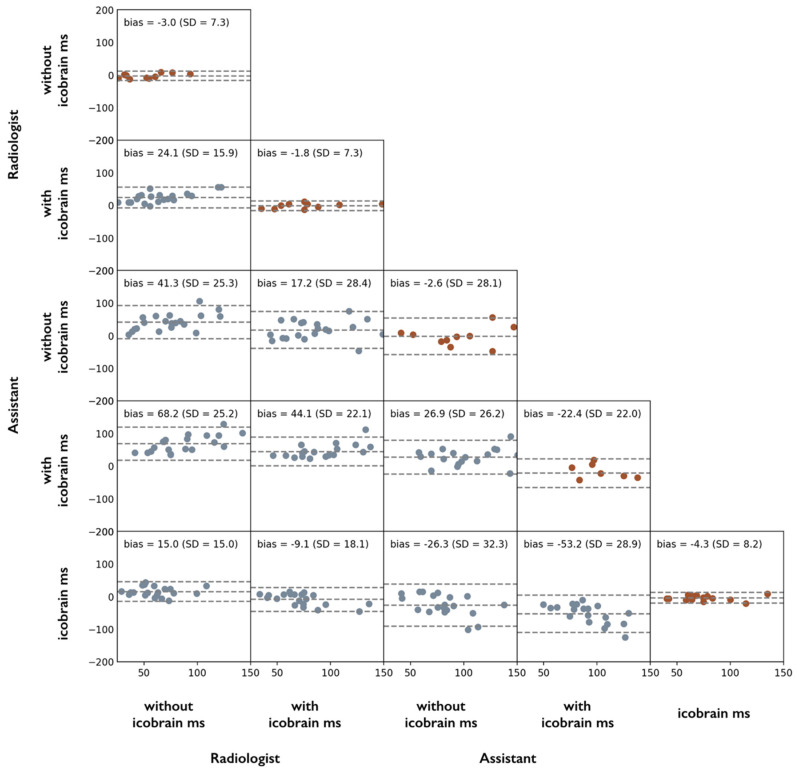
Figure 8.
Bland–Altman plots of total FLAIR lesion counts on scan-rescan MRI data from 10 PwMS for 2 different raters (expert radiologist and assistant neurologist) and different scenarios per rater (without and with icobrain ms). The main diagonal depicts the intra-rater test-retest agreement over the 10 repeated MRI scans. Non-diagonal plots represent inter-rater or inter-scenario comparisons using the complete dataset of 20 MRI scans.

