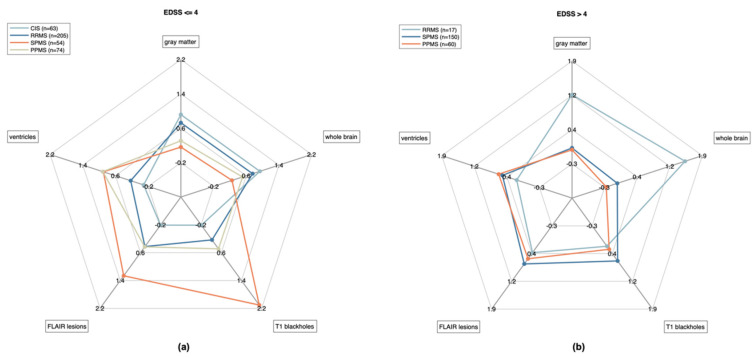
Figure 10.
Volumetric patterns observed with icobrain ms are illustrated for (a) EDSS lower than or equal to 4 and (b) greater than 4 (right). For each considered volume (whole brain, gray matter, lateral ventricles, FLAIR lesions, T1 blackholes), the represented radius goes from low volume in the center to high volume on the exterior (each volume being re-scaled based on 1st and 3rd quartiles in the four groups combined). Solid lines link the median volumes per group.

