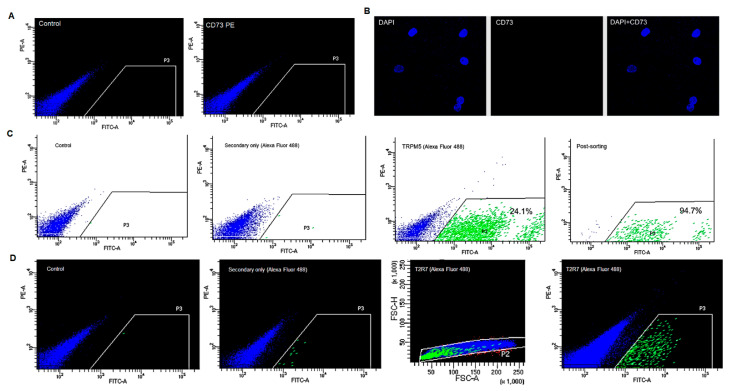
Figure 5.
Flow cytometry analysis of cultured BTBCs. (A) BTBCs stained with anti-CD73 antibody; (B) confocal images to detect the expression of CD73 in BTBCs; DAPI stained nucleus (blue), protein of interest stained with anti-CD73 and combined pictures; (C) flow cytometry analysis of TRPM5-positive BTBCs showing negative control, secondary-only control, TRPM5-positive BTBCs (24.1%) and post-sorting purity analysis (94.7%); and (D) flow cytometry analysis of T2R7-positive BTBCs showing negative control, secondary-only control, excluded doublets shown as red dots outside the FSC-H vs. FSCA data plot and T2R7-positive BTBCs (0.4%).

