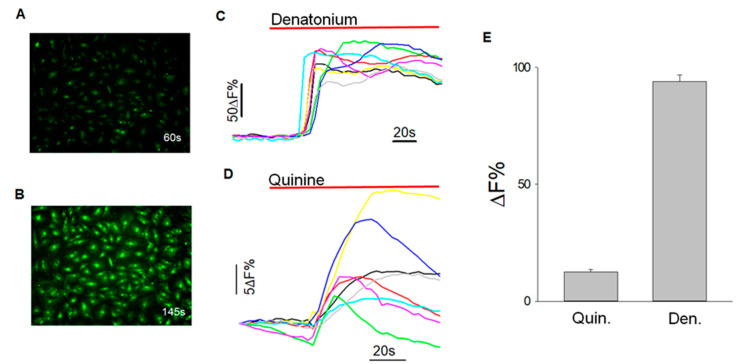
Figure 6.
Calcium imaging to quantify tastant-evoked changes in intracellular calcium level. (A) BTBC before exposure to denatonium (2 mM) at 60 secs; (B) cells with change in fluorescence intensity after exposure to denatonium (2 mM) at 145 secs; (C) graph corresponding to response data of selected cells after exposure to denatonium benzoate (2 mM) after background subtraction; (D) graph corresponding to response data of selected cells after exposure to quinine HCl (462.30 μM); and (E) data are represented as mean (+/−SEM) of an increase in fluorescence (%) from baseline of three independent experiments. Denatonium-induced changes in relative fluorescence (%) was 93.97 +/−2.9 (data obtained from 187 cells of 3 experiments) and for quinine was 12.49 +/−1.11% (data obtained from 44 cells of 3 experiments).

