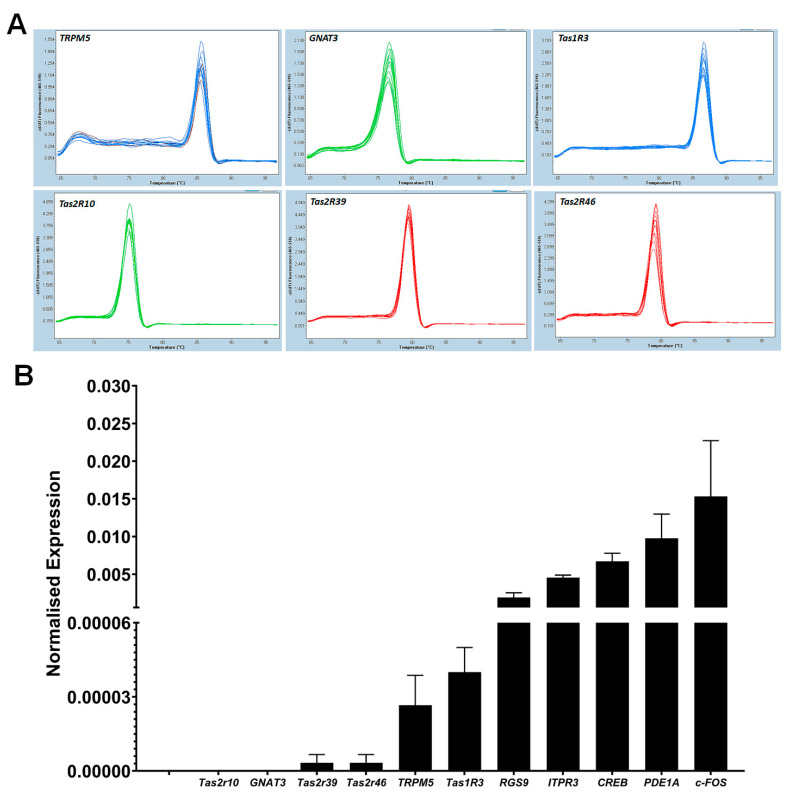
Figure 8.
RT-qPCR analysis of taste specific genes; (A) melting curve analysis of taste specific genes; a single melting peak was observed for each target gene. The X-axis represents temperature (°C) and the Y-axis represents negative first derivative of fluorescence with respect to temperature (−dF/dT). (B) Quantification of taste gene mRNAs using RT-qPCR; each cDNA was normalised to the reference gene PPIA and normalised expression level (y-axis) of each gene was quantified using 2−ΔCq method. Data are reported as mean of relative expression of three independent experiments and bars indicate standard error (±SE).

