Figure 9.
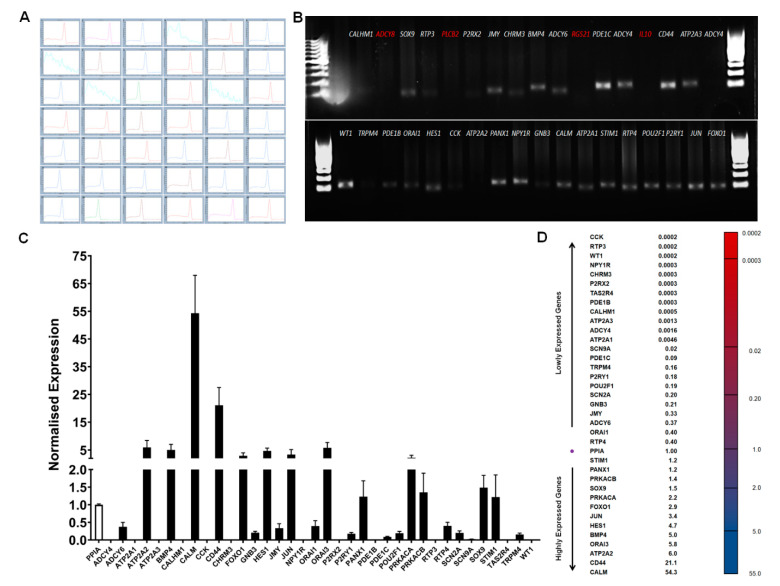
RT-qPCR array-based quantification of genes involved in taste transduction: (A) Melting curve analysis of 42 array genes; no melting peak was observed for the primer sets of IL10 (4), RGS21 (7), PLCβ2 (14) and ADCY8 (17). The X-axis represents temperature (°C) and the Y-axis represents negative first derivative of fluorescence with respect to temperature (−dF/dT). (B) Agarose gel analysis of 35 array genes following a qPCR reaction. A single PCR product with a correct amplicon size was observed for all genes except for the primer sets of IL-10, RGS21, PLCβ2 and ADCY8. (C) Quantification of taste gene mRNAs using custom made RT-qPCR array; each cDNA was normalised to the reference gene PPIA and normalised expression level (y-axis) of each gene was quantified using 2−ΔCq method. Data reported as mean of relative expression of four independent experiments and bars indicate standard error (±SE). (D) Expression profile of RT-qPCR array genes arranged from lowly to highly expressed in BTBCs.

