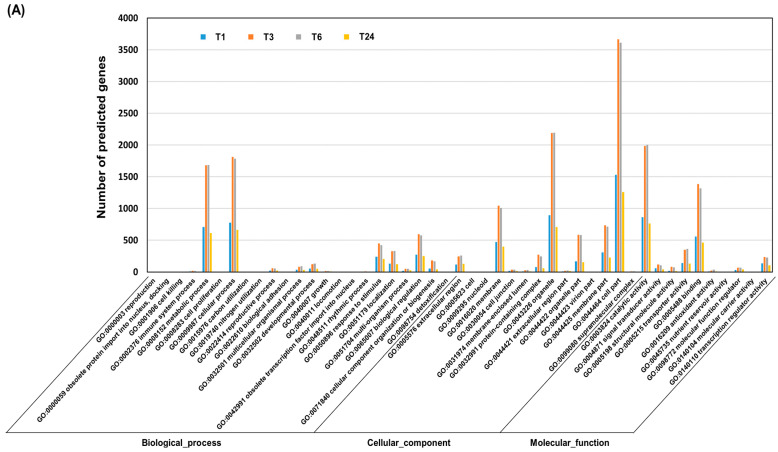
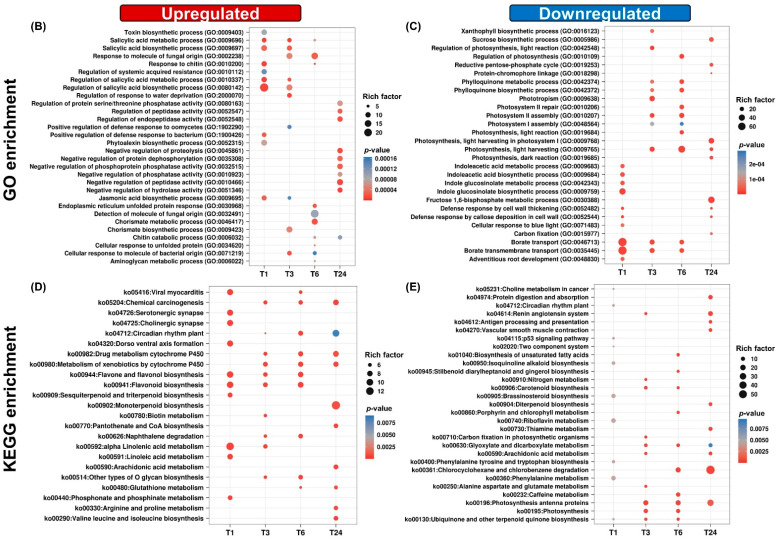
Figure 2.
Gene ontology (GO) and Kyoto Encyclopedia of Genes and Genomes (KEGG) pathway enrichment analysis of the differentially expressed genes (DEGs) following wounding of S. tora leaves. (A) Histogram of the GO classification of the DEGs. The results are summarized in three main categories: biological process, cellular component, and molecular function. (B,C) Dot plot of the GO enrichment of the DEGs. The color of each circle represents the p-value of the GO terms associated with the DEGs at that timepoint compared with T0. The size of the circle indicates the gene-rich factor, which was defined as the ratio of the DEGs assigned to the GO term/all genes assigned to that GO term. (D,E) Dot plot of KEGG pathway enrichment for the DEGs. The color of the circle represents the p-values of the KEGG pathway terms associated with the DEGs at that timepoint compared with T0. The size of the circle represents the gene-rich factor, which was defined as the ratio of the DEGs assigned to the KEGG pathway term/all genes assigned to that KEGG pathway term. The dot plots were generated using the ggplot function in the R package ggplot2.


