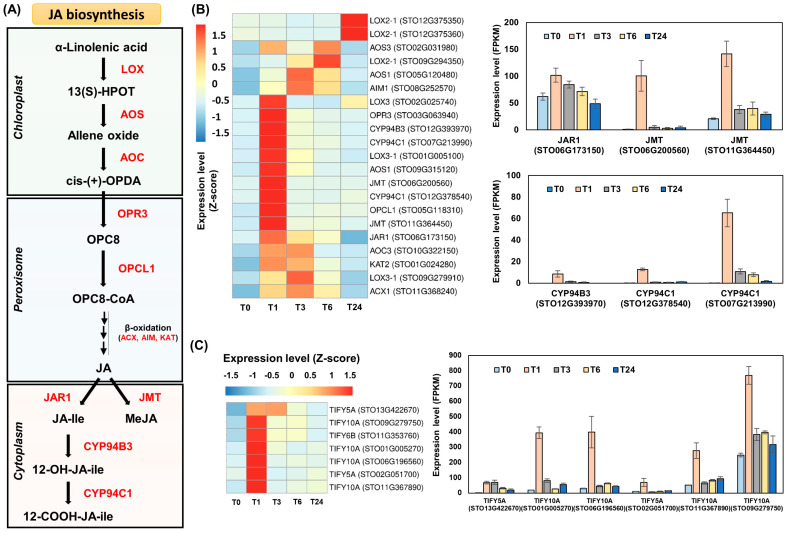
Figure 3.
Jasmonate biosynthesis genes are induced by wounding in S. tora leaves. (A) Jasmonate biosynthesis pathway in plants. 13(S)-HPOT, alpha-linolenic acid 13-hydroperoxide; OPDA, oxo-phytodienoic acid; OPC8, 3-oxo-2-(2′(Z)-pentenyl)-cyclopentane-1 octanoic acid; OPC8-CoA, 3-oxo-2-(2′(Z)-pentenyl)-cyclopentane-1 octanoic acid coenzyme A; JA, jasmonic acid; JA-Ile, jasmonoyl-isoleucine; MeJA, methyl jasmonate; LOX, lipoxygenase; AOS, allene oxide synthase; AOC, allene oxide cyclase; OPR3, OPDA reductase; OPCL1, 4-coumarate-CoA ligase; ACX, acyl-coenzyme A oxidase; AIM, fatty acid beta-oxidation multifunctional protein; KAT, 3-ketoacyl-CoA thiolase; JAR1, jasmonate resistant 1; JMT, JA carboxyl methyltransferase; CYP, cytochrome P450. (B) Heatmap and bar graphs of genes involved in the jasmonate biosynthesis pathway. Genes responsible for JA metabolism are shown in bar graphs (right). (C) Expression analysis of genes encoding TIFY inhibitors. TIFY-encoding genes filtered by a fold change (FC) > 3 are shown in a bar graph (right). The fragments per kilobase of transcript per million mapped reads (FPKM) values of the individual genes were normalized to the Z-score. The heatmap was visualized using the pheatmap package in R. Statistical analysis was performed on the expression levels of each gene expressed at the different times compared with T0 (Table S2).

