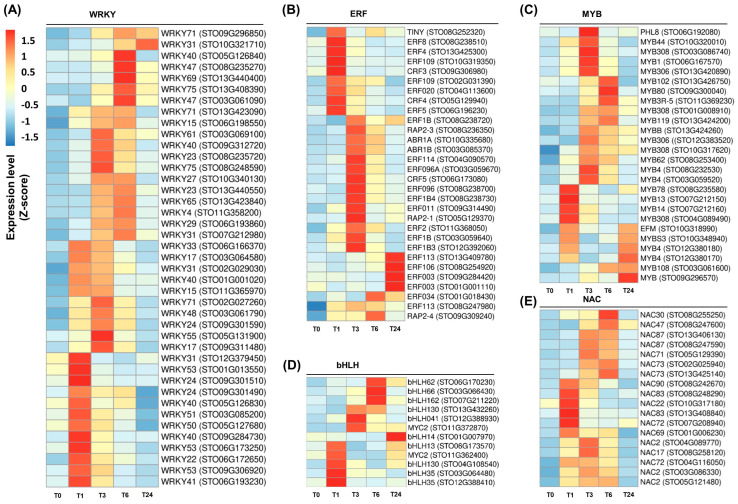
Figure 5.
Induction of transcription factor (TF)-encoding genes following wounding in S. tora leaves. (A–E) Heatmap analysis of genes encoding WRKY (A), ERF (B), MYB (C), bHLH (D), and NAC (E) TFs. The fragments per kilobase of transcript per million mapped reads (FPKM) value for each individual gene was normalized to the Z-score. The heatmap was visualized using the pheatmap package in R. Statistical analysis was performed on the expression levels of each gene expressed at the different times compared with T0 (Table S3).

