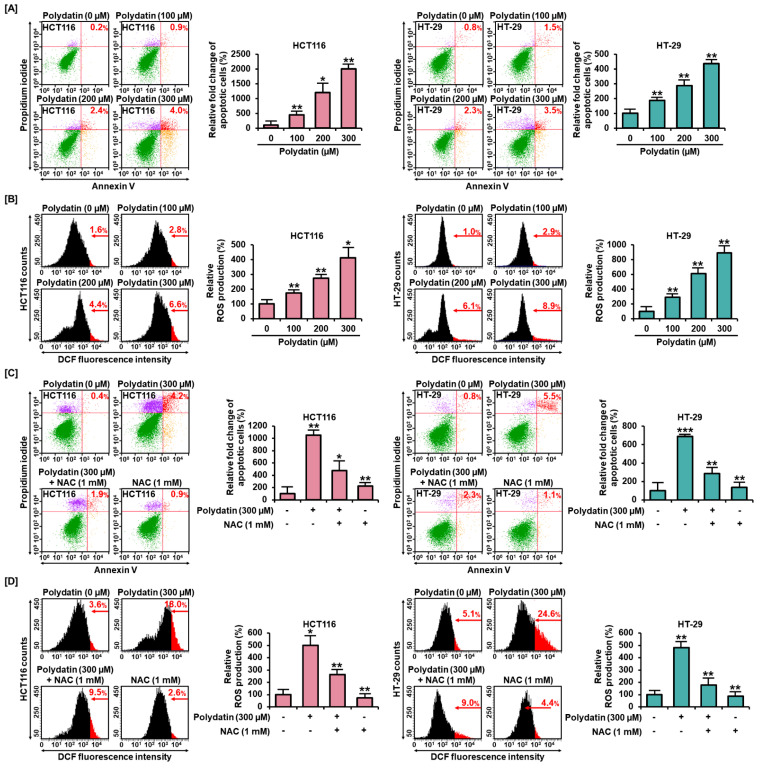
Figure 2.
ROS production and apoptosis in response to polydatin in HCT116 and HT-29. (A) Apoptotic HCT116 and HT-29 treated with polydatin were evaluated using Annexin V and PI dyes. The red in the dot plot indicates late apoptotic cells. (B) ROS generation was determined using dichlorofluorescin (DCF) fluorescent dye by flow cytometry. (C) With or without ROS scavenger, the apoptotic cells induced by polydatin were stained using Annexin V and PI dyes. (D) The effects of polydatin ROS generation with or without NAC in HCT116 and HT-29 cells were analyzed by flow cytometry. The asterisks indicate statistical significance of the effect of treatment (* p < 0.05, ** p < 0.01, and *** p < 0.001).

