Figure 1.
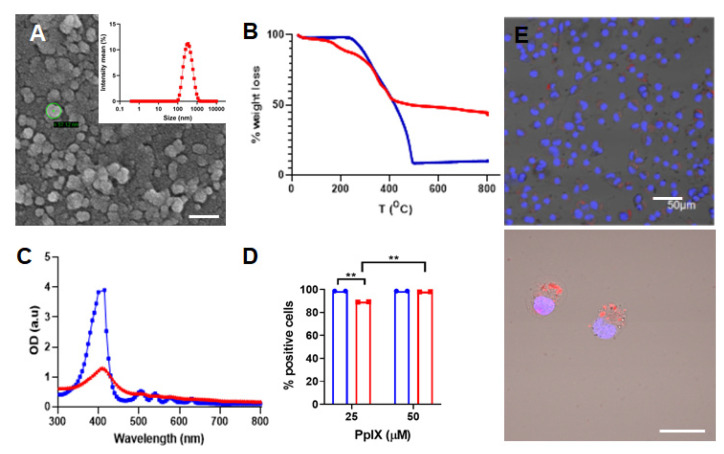
Characterization of PpIX-PSilQ NPs. (A) DLS and SEM image of PpIX-PSilQ NPs. Scale bar = 100 nm. (B) TGA plot for PpIX (blue) and PpIX-PSilQ NPs (red). (C) UV-vis spectrum of PpIX (blue) and PpIX-PSilQ NPs (red). (D) Flow cytometry data of PpIX-PSilQ nanoparticles (red) and free PpIX (blue) at different concentrations (25 and 50 µM PpIX) in A375 cells after 24 h of incubation. Statistics: two-way ANOVA using Tukey’s multiple comparison test; ** p ≤ 0.01. (E) Confocal microscopy images of A375 cells after 24 h incubation with PpIX-PSilQ NPs (25 µM PpIX). Image(s) show merged fluorescent channels of Hoechst-33342 nuclear stain dye (blue), PpIX fluorescence (red), and brightfield. Scale bars = 50 µm and 20 µm.

