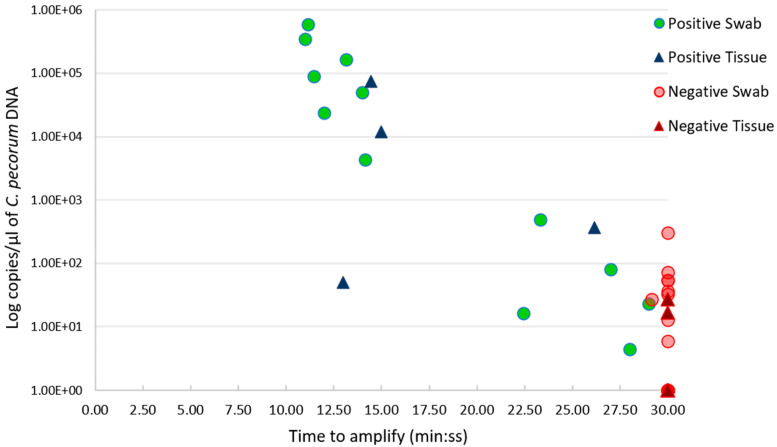
Figure 1.
Scatter plot showing the relationship between the C. pecorum genome copies/µL of extracted DNA (Y axis), and LAMP results, presented as time to amplify (min: ss) (X axis). Positive LAMP results are outlined in green circles for swab samples, and in dark blue triangles for tissue samples. Negative LAMP results are denoted by red circles for swab samples, and dark red triangle for tissue samples.

