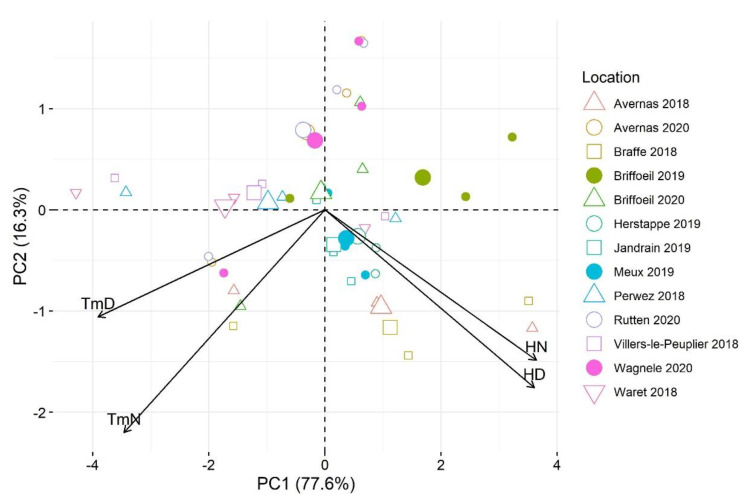
Figure 3.
Biplot of the first two axes of the principal component analysis summarizing the relationships between climate variables and sugar beet/Cercospora leaf spot experimental sites during the June-August period of 2018–2020. TmD: mean temperature during daytime, TmN: mean temperature during nighttime; HD: mean relative humidity during daytime; and HN: mean relative humidity during nighttime. Daytime and nighttime were defined as the periods between 7.00 a.m. to 8.59 p.m. and between 9.00 p.m. to 6.59 a.m. the following day, respectively.

